I am interested in studying novel solutions to the problem of analyzing, visualizing, and communicating big data at high interactivity and fidelity. My research team investigates theories and technologies that ensure the scalability of end-to-end big data analysis and visualization workflow. Along this direction, we explore new holistic approaches involving the visualization algorithm, system, and user aspects.
Our research effort has been leading to a number of new scalable algorithms and systems, which have helped the scientists from several universities and national laboratories to obtain accurate and efficient visualizations for their applications, such as turbulent combustion, climate modeling, geophysical analysis, medical imaging, plant phenotyping, and so on.
Our research has been sponsored by the National Science Foundation, U.S. Department of Agriculture, the Department of Energy, Sandia National Laboratories, the Nebraska Department of Natural Resources, and the University of Nebraska-Lincoln.
 |
||||
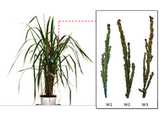
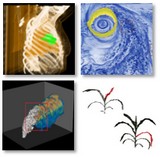
| Plant Phenotyping | |
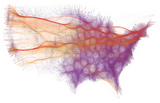
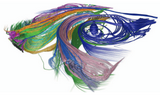
Graph Visualization and Analysis | ||
|
Capture and track plant growth dynamics to understand how complex interaction between genotype and environment determines plant phenotypic characteristics. PAPER: Interactive Hyperspectral Visualization, 3D Imaging Systems, PhenoImage, SeedExtractor, Panicle Imaging, Hyperspectral Image Vis, Plant Event Detection, 3D Leaf Reconstruction, LiDAR-based Imaging VIDEO: Interactive Hyperspectral Visualization RESOURCE: PhenoImage, Hyperspectral Analyzer, SeedExtractor |
|
Develop scalable visual analytics techniques for very large graphs by exploiting graph structure properties and computer systems optimization. PAPER: MLSEB, EB Evaluation, TBEB, Unified Community Detection, Scalable Louvain, Scalable Infomap, Parallel Modularity, Eye Tracking Vis, Tweether, CommGram RESOURCE: CSET, CommGram |
|
|
|
||||
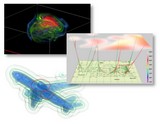
| In Situ Visualization and Analysis | |
Distributed and Parallel Visualization | ||
|
Holistically and collaboratively design the key aspects from data generation processes, data analysis and visualization algorithms, to software and hardware systems to enable exascale computing. PAPER: In-staging Data Placement, Adaptive Data Placement, GoldRush, Cross-Layer Adaptations, FlexIO, In-Situ/In-Transit, Combustion, In Situ Ultrascale Simulation Vis, Earthquake, End-to-end Pipeline VIDEO: In Situ Visualization of Earthquake Simulation |
|
Develop highly scalable algorithms to fully use GPU clusters or supercomputers to generate high-performance, high-quality, and high-fidelity visualization of big data. PAPER: Geodesic Data, Parallel Feature Tracking, Trajectory Clustering, Distributed Explorable Image, 2-3 Swap, Blue Gene, Parallel Flow Vis, Earthquake Parallel Vis VIDEO: Combustion, Supernova |
|
|
|
||||
| Data Reduction and Representation | |
Vector Field Visualization | ||
|
Extract and track salient features that can be used for reducing data and exploring relationships among time-varying multivariate data. PAPER: Adaptive Volume Compression, Particle Flow, Radiomics, Boundary-Structure-Aware TF, Parallel Distance Tree, Information Transfer, Explorable Image, Application-Driven Compression, Importance-Driven Vis, Feature Modeling VIDEO: Information Transfer, Application-Driven Compression, Importance-Driven Vis RESOURCE: Adaptive Volume Compression, Particle Flow, Boundary-Structure-Aware TF |
|
Portray complex structure and direction of a vector flow field, and analyze patterns inherent in large particle trajectory data. PAPER: Trajectory-based Feature Tracking, Hierarchical Streamline Bundles, Combustion Particle Trajectory, Illustrative FlowVis, Dual Space Analysis, Sketch-based UI, Parallel FlowVis, Structure-accentuating FlowVis VIDEO: Hierarchical Streamline Bundles, Dual Space Analysis, Sketch-based UI |
|
|
|
||||
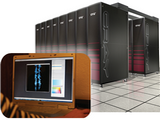
| High Performance Interactive Systems | |
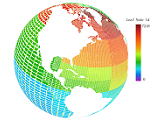
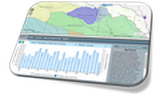
Geographic Data Visualization | ||
|
Improve the efficiency of clusters to support interactive analysis visualization services of big data by addressing key performance bottlenecks, such as I/O, job scheduling, and so on. PAPER: Eirene, Dice, Eunomia, Application-Aware Data Prefetching, Legion-based Analytics, FlexIO, GPU Scheduling End-to-End Parallel Vis, Parallel IO, IO Strategies RESOURCE:Application-Aware Prefetching |
|
Develop new techniques in support of scalable geographic visualization and analysis in a data-intensive environment. PAPER: Big Earth Vis, STARE+netCDF+MPI, Spark vs. SciDB, Variety Challenge, Extendable UI, Connected Component Labeling, Interactive Geodesic Vis VIDEO: EarthCube ODL |
|
|
|
||||
NSF Projects
| NSF IOS 2514397 | RESEARCH-PGR TRACK: Genetic basis of developmentally regulated heat stress response in rice (PI: Dr. Harkamal Walia) |
| NSF OAC 2430234 | CC* Compute-Campus: PLUMAGE: Promoting Learning Using Mixed Advanced GPU Environments (PI: Dr. Adam Caprez) |
| NSF OAC 2232851 | CC* Data Storage: NRDStor: Nebraska Research Data Storage (PI: Dr. Derek Weitzel) |
| NSF OIA 1736192 | Comparative Genomics and Phenomics Approach to Discover Genes Underlying Heat Stress Resilience in Cereals (PI: Dr. Harkamal Walia) |
| NSF IIS 1652846 | Scalable Techniques for Visualizing Very Large Graphs |
| NSF DBI 1564621 | A Computational Framework for Integrating Image Informatics with Transcriptomics for Discovering Spatiotemporally Resolved Regulatory Gene Networks in Plants (PI: Dr. Harkamal Walia) |
| NSF DBI 1556186 | Multispectral Laser 3D Ranging and Imaging System for Plant Phenotyping (PI: Dr. Yufeng Ge) |
| NSF ICER 1541043 | Optimal Data Layout for Scalable Geophysical Analysis in a Data-intensive Environment |
| NSF IIS 1423487 | A Scalable Visual Analytics Framework for Exascale Scientific Simulations |
| NSF CNS 1116606 | SANE: Semantic-Aware Namespace in Exascale File Systems |
| NSF CNS 1016609 | A Semantically-Smart SSD-based RAID System for Internet-Scale Applications |