CommGram
Introduction
CommGram is a visual analytics tool for large-scale communication data from massively parallel program. The development of CommGram is inspired by the visual output of ElectroCardioGramin that the electrical activity of the heart is represented as a curve of wave over a period of time. CommGram can generate a similar output that uses a simple curve to represent the dynamics of communication patterns over time. More specifically, the amount of variance along the curve corresponds to the degree of changes of communication patterns: a flat section means that the communication pattern is largely constant, while a highly wavy section indicates that communication pattern is changing dramatically. This visual presentation provides a clear summarization of the time-varying communication events across many processors. In addition, once a user detects an interesting pattern from the high-level overview, CommGram allows the user to seamlessly zoom-in on a particular time interval and examine the detailed data exchanges across a particular set of processors. Our tool enables an interactive exploration of large communication data without visual clutter, and clearly shows the dynamic communication patterns in a coherent and scalable fashion.
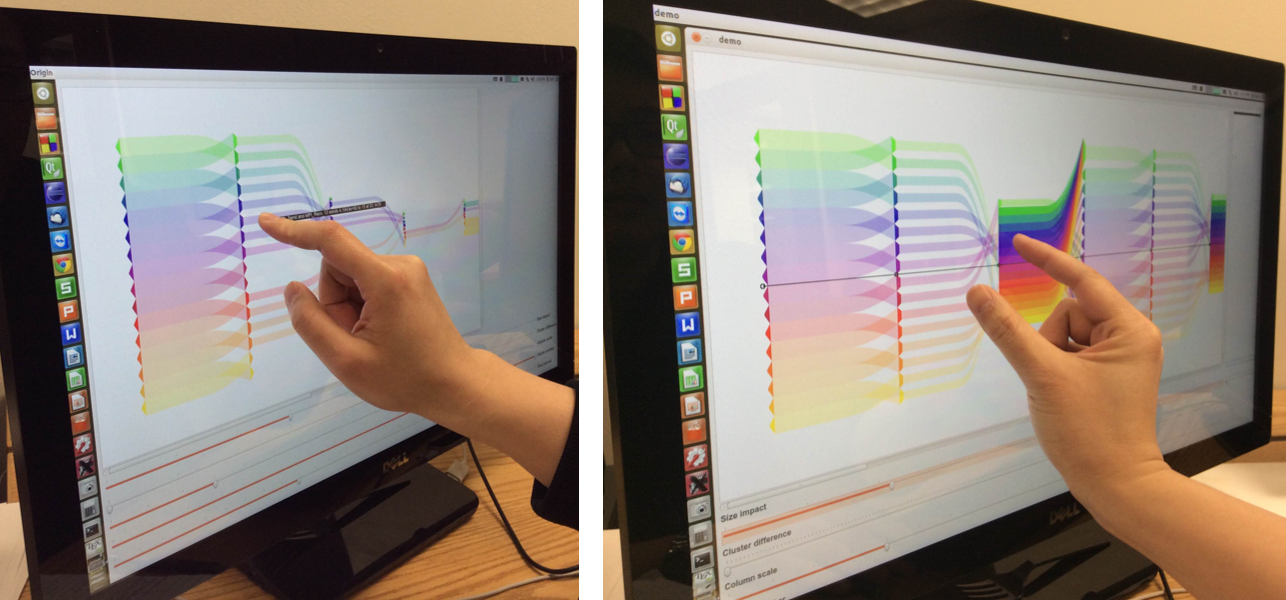
Interactive exploration of communication data using CommGram.
Source code
Click here to download the source code of the prototyping.
Dependencies
The tool needs to be complied and ran using g++, QT, and OpenGL.
Running
CommGram is developed using QT and under Linux. There are two ways to build and run CommGram. First, open CommGram's QT project file COMMGRAM.pro in QT Creator IDE. The source code will be then loaded into the IDE. QT Creator IDE can compile and run the code, and also build the executable. Second, CommGram can be also built without QT Creator IDE. Open a terminal, and type
qmake CommGRAM.pro. This will generate a Makefile including the source code, the dependencies, and building commends. Then, using make to generate the executable.
Publication
Visual Analytics for Large Communication Trace Data
Jieting Wu. Master Thesis, University of Nebraska-Lincoln, May, 2015.
[PAPER]
CommGram: A New Visual Analytics Tool for Large Communication Trace Data Jieting Wu, Jianping Zeng, Hongfeng Yu, Joseph P. Kenny. Proceedings of the Workshop on Visual Performance Analysis (VPA), held in conjunction with SC14, November, 2014.
DOI: 10.1109/VPA.2014.8 [PAPER]
CommGram: A New Visual Analytics Tool for Large Communication Trace Data Jieting Wu, Jianping Zeng, Hongfeng Yu, Joseph P. Kenny. Proceedings of the Workshop on Visual Performance Analysis (VPA), held in conjunction with SC14, November, 2014.
DOI: 10.1109/VPA.2014.8 [PAPER]
Citation
@mastersthesis{wu2015visual,
  title={Visual Analytics for Large Communication Trace Data},
  author={Wu, Jieting},
  school={University of Nebraska-Lincoln},
  year={2015}
}
@inproceedings{wu2014commgram,
  title={Commgram: A new visual analytics tool for large communication trace data},
  author={Wu, Jieting and Zeng, Jianping and Yu, Hongfeng and Kenny, Joseph P},
  booktitle={2014 First Workshop on Visual Performance Analysis},
  pages={28--35},
  year={2014},
  organization={IEEE}
}
Contact