Mass spectrometry (MS) is a useful tool for computer-assisted and automated analyses of the complex separations produced by GCxGC. In GCxGC-MS, each sample output of the GCxGC separation is analyzed by MS, e.g., time-of-flight (TOF) MS. Then, instead of a single value at each sample output, there is a mass spectrum consisting of an array of (mass/z, intensity) pairs. These mass spectra can be used in identifying unknown chemicals and in separating co-eluting peaks for more accurate quantification.
GC Image stores GCxGC-MS data in two files: a GCI file containing metadata (as described in chapter Image Input and Output) and a binary file containing the MS data in the Common Data Format (CDF). CDF, developed by the National Space Science Data Center (NSSDC), is a "self-describing data abstraction for the storage and manipulation of multidimensional data in a discipline-independent fashion."[NSSDC] Most MS systems support export of data in CDF format for non-proprietary data interchange. Using the GCI and CDF files, the GC Image file operations Open, Recent Images, Save, Save As, Close, and Exit work for GCxGC-MS images as they do for GCxGC images (described in chapter Image Input and Output).
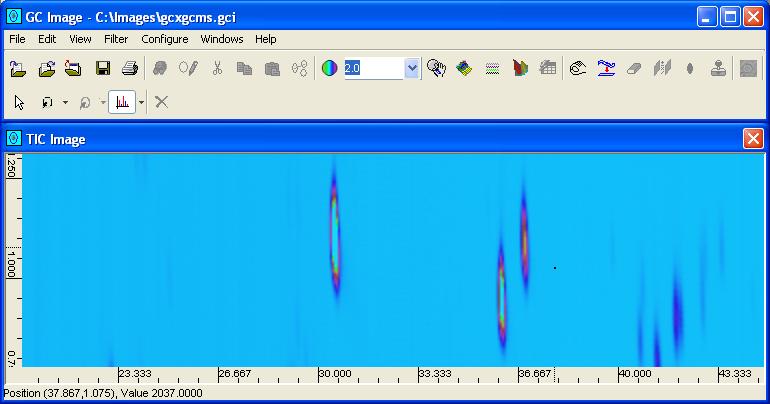
GC Image supports importing GCxGC-MS data from files in CDF. To import GCxGC-MS data contained in a CDF file, select the Import Image option from the File menu or click the Import Image button from the tool bar of the Image Viewer. GC Image prompts the user to enter the source and target filenames and metadata (such as size). GC Image then imports the GCxGC-MS data and displays an image of the total ion count (TIC) at each pixel, as pictured in Figure 1. The TIC is the sum of intensities of all mass/z values for the sample. Most of the image visualization, processing, and analysis tools for GCxGC data are available for GCxGC-MS data. Some of the tools specific to GCxGC-MS are described in this chapter.
|
|
| Figure 1. An image of the total ion count (TIC) values for GCxGC-MS data. |
For GCxGC-MS data, the import dialog allows the user to optionally limit the maximum number of values in each mass spectrum. GCxGC-MS analyses generate very large data sets that may exceed the memory capacity of desktop systems, causing very slow processing. One approach to processing GCxGC-MS data more quickly is to reduce the size of the GCxGC-MS data by retaining only the elements with the largest intensity values in each mass spectrum and using sparse matrices to store the reduced mass spectra.
For example, a GCxGC-MS image with 756x800 GCxGC samples and 215 intensity values in each mass spectrum requires nearly one gigabyte of memory (using four byte integers for the mass/z and intensity values) as shown in Table 1. If only the 32 elements with the largest intensity are stored for each mass spectrum, the memory requirement is reduced drastically to about 0.15 gigabytes as shown in Table 2.
| Mass/Z values array | 756 x 800 x 215 x 4 = 520,128,000 Bytes | 496.03 MB |
| Intensity values array | 756 x 800 x 215 x 4 = 520,128,000 Bytes | 496.03 MB |
| Total memory required to store both the arrays: | 992.06 MB | |
| Mass/Z values array | 756 x 800 x 32 x 4 = 77,414,400 Bytes | 73.82 MB |
| Intensity values array | 756 x 800 x 32 x 4 = 77,414,400 Bytes | 73.82 MB |
| Total memory for both the arrays | 147.64 MB | |
Of course, the gain in storage and processing efficiency must be weighed against the loss of data. Figure 2 shows the reduction of a mass spectrum to retain only the values with the largest intensity in a sparse representation.
|
| Figure 2. An example of mass spectrum data reduction with sparse representation. |
The GC Image Mass Spectrum Viewer provides both graphical and tabular views of the selected mass spectrum (e.g., as illustrated in Figure 3).
|
| Figure 3. The Mass Spectrum Viewer GUI. |
The tabular view (on the right side) has two columns: one for mass/z values and one for the corresponding intensity values in the mass spectrum. The scrollable table orders entries by mass/z value. At the top of the table is the total intensity count (TIC) for the mass spectrum.
In the graph (on the left side), the mass/z values are on the horizontal axis and the intensity values are on the vertical axis. The range for the horizontal axis is determined by the minimum and maximum mass/z values in all mass spectra of the image (so, the same absolute scale is used for the horizontal axis in all the mass spectra graphs). The domain for the vertical axis is from zero and to the largest intensity value in the selected mass spectrum.
As the cursor is moved across the graph, the mouse-over tool-tip indicates the mass/z and intensity value, as in Figure 3.
GC Image supports selecting mass spectra for viewing in three modes:
 |
 |
 |
In Point Mass Spectrum mode, when the user clicks the left mouse-button on a point in the TIC image (e.g., as in Figure 1), GC Image retrieves the mass spectrum for the corresponding sample and displays the mass spectrum in a popup window, as in Figure 3.
In Peak Mass Spectrum mode, when the user clicks in a blob in the TIC image, GC Image displays the mass spectrum of the sample within the blob that has the largest total ion count (TIC), i.e., the mass spectrum at the blob peak. This mode is accessible only after blob detection has been performed.
In Blob Mass Spectrum mode, when the user clicks in a blob in the TIC image, GC Image displays the sum of all of the mass spectra of all the samples in the selected blob. In computing the sum, the mass/z values are rounded to the nearest integer. This mode is accessible only after blob detection has been performed.
Using the Mass Spec panel in Configure Settings, the user can specify whether successive selections of mass spectra are presented in multiple windows (in which case a new window is opened for each successive mass spectrum) or in a single window (in which case the previous mass spectrum graph is replaced in the same window by the new mass spectrum). The Windows pull-down menu in the Image Viewer allows switching focus between multiple windows that may be open.
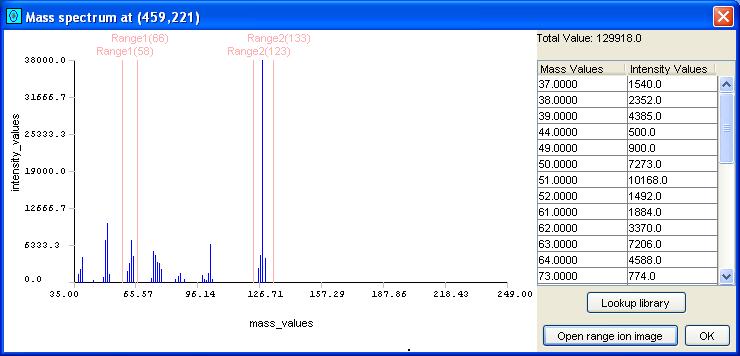
The Mass Spectrum Viewer allows the user to subset the mass spectrum, by selecting one or more mass/z subranges. Mass spectrum subranges are particularly useful for generating ion chromatogram images, described below. To specify a subrange of mass/z values (including a subrange with a single mass/z value), the user clicks-and-drags the left mouse-button in the graph area of the Mass Spectrum Viewer. Additional subranges can be added by depressing the Control-Key during click-and-drag. Overlapping subranges are merged. A click-and-drag without the control key clears any previously selected subranges. Figure 5 illustrates a mass spectrum with two subranges specified.
|
| Figure 5. A mass spectrum in the Mass Spectrum Viewer with two subranges selected. |
The Mass Spectrum Viewer has a button to generate an ion chromatogram image. Ion chromatogram images are constructed with each pixel having the value of the total intensities in one or more mass/z subranges in the mass spectrum of the corresponding sample. An example ion chromatogram image for the mass/z subrange 120-134 is illustrated in Figure 6.
To generate an ion chromatogram image, first select a chromatogram (for a pixel, peak, or blob) displayed in a Mass Spectrum Viewer window. Then, in the graphical display area of the Mass Spectrum Viewer, select one or more mass/z subranges. (A subrange may have a single mass/z value.) Finally, click the Open Ion Image button in the Mass Spectrum Viewer control area.
Using the Mass Spec panel in Configure Settings, the user can specify whether successive ion chromatogram images are presented in multiple windows (in which case a new window is opened for each successive ion chromatogram) or in a single window (in which case the previous ion chromatogram is replaced in the same window by the new ion chromatogram image). The Windows pull-down menu in the Image Viewer allows switching focus between multiple windows that may be open.
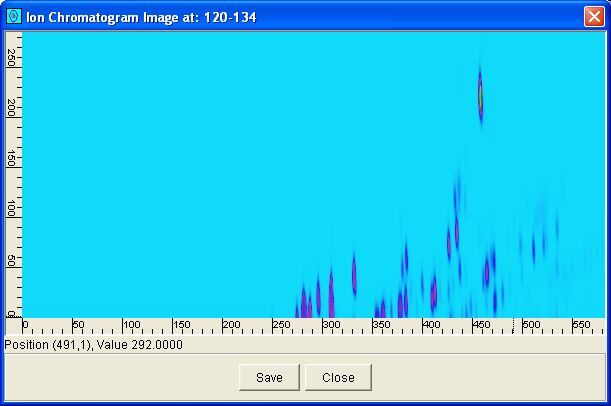 |
| Figure 6. An example ion chromatogram image for the mass/z subrange 120-134. |
The Mass Spectrum Viewer has a button to initiate a library search for the selected mass spectrum. The Lookup Library button invokes a library search to match the selected mass spectrum. A library search also can be performed using mass spectrum subranges.
GC Image interfaces with the National Institute of Standards and Technology (NIST) MS Search Program (Version 2.0) and through it can search the NIST/EPA/NIH Mass Spectral Library, the NIST/EPA/NIH Mass Spectral Demonstration Library, or any mass spectral library that is format-compliant. The CDROM installs the MS Search Program (Version 2.0) and the NIST/EPA/NIH Mass Spectral Demonstration Library, which contains 2400 compounds, a small fraction of the full NIST/EPA/NIH Mass Spectral Library.
GC Image currently supports identity search of the designated library (or libraries). If the unknown compound is likely to be in the library, identity search is the quickest way to find it. Identity search uses a very efficient method of selecting a small set of spectra for subsequent spectrum-by-spectrum comparison. The two types of identity search are Quick Search and Normal Search.
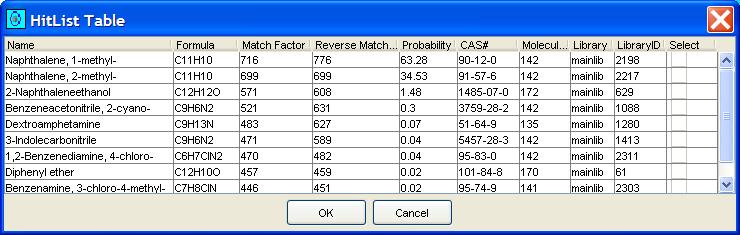
The NIST Mass Spectral Search Program returns a "hit list" of matched chemical compounds from the library and several factors for each matched compound. GC Image displays these in a table, as illustrated in Figure 7. Compounds in the hit list are listed with the following factors:
|
| Figure 7. Example MS Search hit list. |
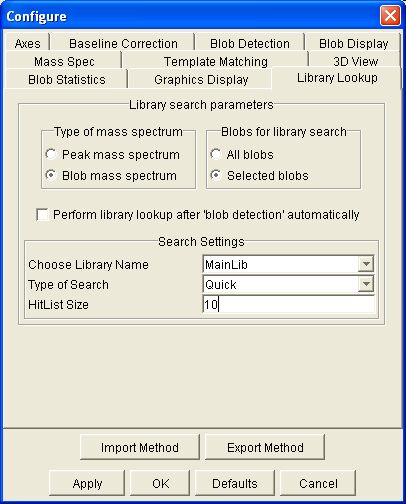
By default, the hit list contains ten compounds with the highest match factor. The user can configure the size of the hit list using the Library Lookup panel in Configure Settings, illustrated in Figure 8. The user also can designate the library to be searched and the type of identity search.
|
| Figure 8. Library search configuration pane. |
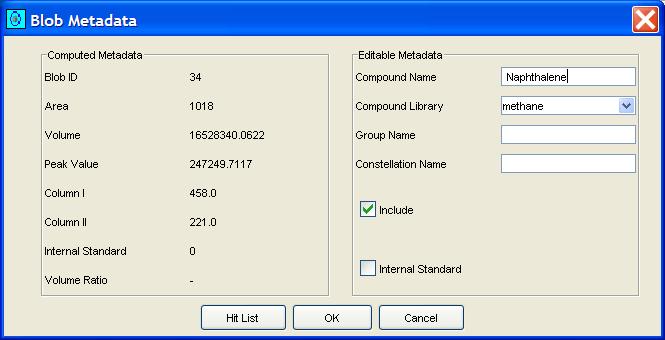
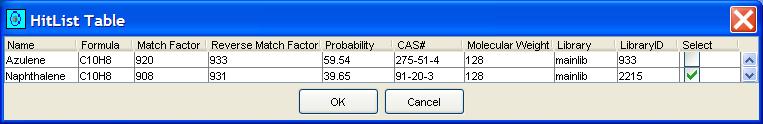
GC Image can use the library search to automatically set the compound names for blobs. Clicking the Search MS Library button on the Image Viewer tool bar or selecting Search MS Library from the Filter menu submits one or more blob (peak or integrated) mass spectra for library search and sets the compound name of each submitted blob to that of the library compound with the largest match factor for that blob's mass spectrum. After library search for a blob, GC Images maintains the "hit list" for that blob, which can be accessed via the blob metadata popup, as pictured in Figure 9. The user can choose interactively any compound in the hit list as the name of the blob, overriding the initial identification of the compound with the largest match factor, as illustrated in Figure 10.
|
| Figure 9. Blob Metadata popup with a button to access the hit list. |
|
| Figure 10. Example MS Search hit list for a blob. |
Contents
Previous: Processing Configurations
Next: Project Management
GC Image™ Users' Guide © 2003, 2002, 2001 by GC Image LLC and the University of Nebraska.