|
|
CXP-Powered I-MINDS Capabilities 4.0 |

Analysis
Tools 4.0
Note that in our
previous discussions, we included this discussion with each capability
separately. For this version and beyond,
we pool these discussions into this section, in hope of giving a better, more
complete big picture of the analyses that one could do with CXP+I-MINDS.
5.1. Introduction
To assist both
users and moderators analyze the data tracked by CXP+I-MINDS, we have designed
several tools: 1) VirtualClassroom, 2)
Statistics, 3) DatabaseSearch, and 4) QuizStats. All four of these tools are available in the
Moderator version, while users only have Statistics and DatabaseSearch.
QuizStats is the only new analysis tool in version 4 of CXP+I-MINDS, but we
have modified VirtualClassroom to provide more statistical information based on
the increase in statistical tracking done in version 4. In versions 2 and 3, VirtualClassroom had a
limited set of statistics, and also included an overview of all message traffic
from the system in the form of message and topic lists, but we removed these
because they were not used during deployment.
Also, for version 4, we included the Statistics tool in the user version
to replace its text-based predecessor, which was available in all prior
versions of CXP+I-MINDS, to accommodate the increase in statistical tracking
and to provide information in an easier to analyze format. DatabaseSearch has remained unchanged from
its design in version 3.
All statistical
modeling is done by each user agent based on their user’s interactions with
other users. Moderators receive their
statistics from the user agents and the values stored in the database. For version 4, we added new statistics, and
grouped the statistics by mode instead of by type as was done in previous
versions. The current set of statistics
used by the Virtual Classroom and Statistics tools are shown in the tables
below:
|
QuestionAnswering |
BuddyChat/StructuredChat |
|
Questions Asked Per Session |
Messages Sent Per Session |
|
Questions Answered Per Session |
Number of Topics Started Per Session |
|
Questions Broadcast Per Session |
Number of Topics Started by Others Per Session |
|
Average Question Length |
Responses Received Per Session |
|
Average Keywords in Questions |
Average Dialog in Topics Started |
|
Average Question Score |
Average Self Dialog Improvement |
|
Max Question Score |
Average Other Dialog Improvement |
|
Min Question Score |
Average Response Time |
QuizMode |
|
Number of Quizzes |
|
Percent of Quizzes Completed on Time |
|
Average Quiz Duration |
|
Average Questions Per Quiz |
|
Percent of Questions Seen |
|
Percent of Questions Correct |
|
Percent of Questions Incorrect |
|
Percent of Questions Unanswered |
|
Percent of Points Earned |
|
Average Token Requests Per Quiz* |
|
Average Tokens Granted Per Quiz* |
|
Questions Seen With Token Per Quiz* |
|
Questions Answered With Token Per Quiz* |
|
Average Time With Token Per Quiz* |
* Collaborative Quiz only
Tables 5.1 - 5.3:
Statistics for each Mode
5.2. Virtual Classroom Tool
The Virtual
Classroom form is very useful for moderators.
It displays in-depth statistical information about each user computed
over a given number of sessions (i.e., uses of the system). Users are represented by small pie charts,
with each chart split into five pieces.
Each piece corresponds to their statistics for a specific mode (i.e.,
QuestionAnswering, BuddyChat, StructuredChat, Individual Quizzes, and
Collaborative Quizzes). The pieces are
colored blue if the user is at or above the thresholds for those statistics (as
set by the moderator) and colored red if the user falls below the set
thresholds. Furthermore, all red pie
slices are separated from the rest of the chart, and the more “bad” statistics
a user has, the further the slice is from the chart. This system makes it easy for moderators to
quickly analyze and compare the performance of all users at a glance. The thresholds for the statistics are stored
in the database so the moderators can set persistent levels and only modify
when desired. An example of the Virtual
Classroom for can be seen in Figure 5.1.
Clicking on a
user populates the list view on the right side with numerical values for each
statistic, with bad ones once again highlighted in red. Also, clicking on a specific slice in a chart
loads the Statistics tool (described in the next section) with the proper
information for in-depth analysis.
Finally, hovering the mouse over any chart gives the user’s name and
identifier in a tooltip. If a slice is
under the mouse, a listing of statistics that failed to meet the threshold is
added to the tooltip for easy identification.
Whenever the
form is loaded or updated, the moderator agent checks the statistics for every
mode and tries to find modes that are especially problematic for most
users. If it finds any such modes, it
alerts the moderator of such problems, as shown in Figure 5.1.

Figure 5.1: The
VirtualClassroom Tool with Problem Alert
5.3. Statistics Tool
The Statistic
form is used to display statistics information about users in bar charts for
easy comparison of values. For each
mode, users and moderators can choose to display all the statistics of any
individual user or the values for each user for an individual statistic. Once again, statistics that fall at or above
the thresholds set by moderators are shown in a blue color and those that fall
below thresholds are shown as a red color.
The thresholds are the same ones recorded in the database by the Virtual
Classroom form, and any change to the thresholds is propagated in both forms to
all users. Once again, the stats are computed for the number of sessions
specified in the bottom left corner of the screen, which is also tied to the
corresponding option in Virtual Classroom for moderators. For an example of the Statistics Charts form,
please consult Figure 5.2.

Figure 5.2: The Statistics Chart Tool
5.4. Database Search
In order to
allow users and moderators to search through all of the message content
archived by CXP+I-MINDS, we have developed a tool called DatabaseSearch, shown
in Figure 5.3. This tool allows for
searching for messages by any associated metadata, including when the message
was sent, what type of message it was, any keywords, etc. For any found messages, a message tree can
also be constructed by right clicking on the message, then choosing to build a
message tree. The tool also allows for
searching for different users in the system, which displays their name,
identifier, and the number of messages they have sent in the current
classroom. Right clicking on a user
brings up an option to search for that user’s current buddies. Moderators can also right click on a user to
bring up an option to view all messages sent by that user. Users do not have this option because they
are only allowed to search for their own message. This limitation is imposed because we don’t
want users to be able to find messages they otherwise wouldn’t have been able
to see through the QuestionAnswering, BuddyChat, and StructuredChat modes.

Figure 5.3: The DatabaseSearch Tool
5.5. QuizStats
The final
analysis tool provided by CXP+I-MINDS is QuizStats, shown in Figure 5.4, which
displays statistical information about quiz results. Unlike the other analysis tools, which are
available from the main IMINDS form, QuizStats is loaded from the QuizMode
form. This tool allows moderators to
choose from different assigned quizzes, organized by name and when they were
assigned. It then displays important
statistical information about the quiz, such as the average, median, min, max,
and standard deviation of score, average duration, and which questions were
answered correctly and incorrectly the most often. The form also displays the score given to each
user if it was an individual quiz, or to each group if it was a collaborative
quiz. The form also provides a bar chart
showing how many users or group answered each question correctly. Finally, the form provides a listing of all
questions in the quiz. If a moderator
selects a specific question, the form changes to show which answers each user
or group selected (with wrong answers highlighted in red), and the bar chart
shows how many people selected each possible answer, with correct answers
colored blue and incorrect answers colored red.
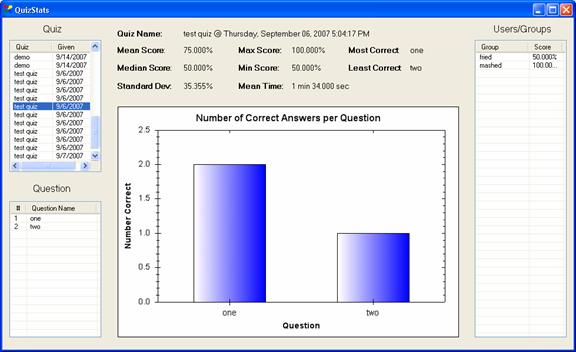
Figure 5.4: The QuizStats
Tool