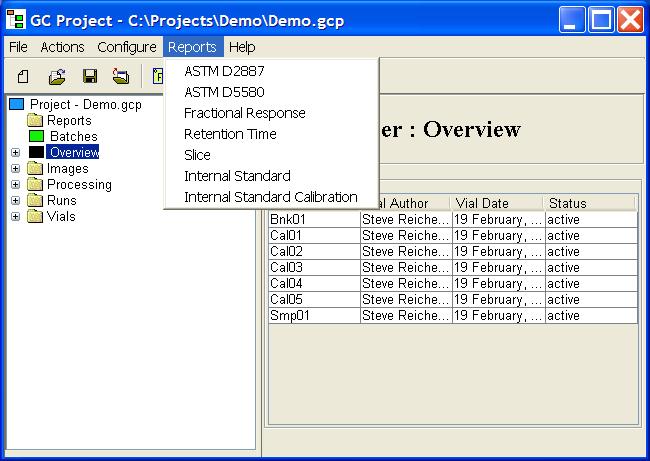
The type of report to be generated is selected from the Reports menu of GC Project, illustrated in Figure 1. Currently only the following report types are supported:
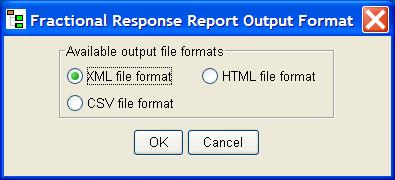
Each of the reports can be generated in any of several file formats:
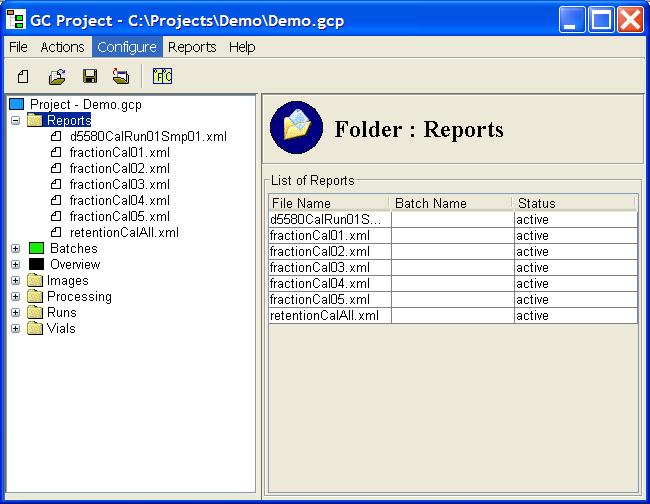
GC Project also presents a popup dialog for the user to select a filename for the report. The report is stored in the Reports directory under the specified filename and is listed in the Project Tree under the Reports node. Clicking on the Reports node in the Project Tree presents in the Component Information pane a table of saved reports, as shown in Figure 3.
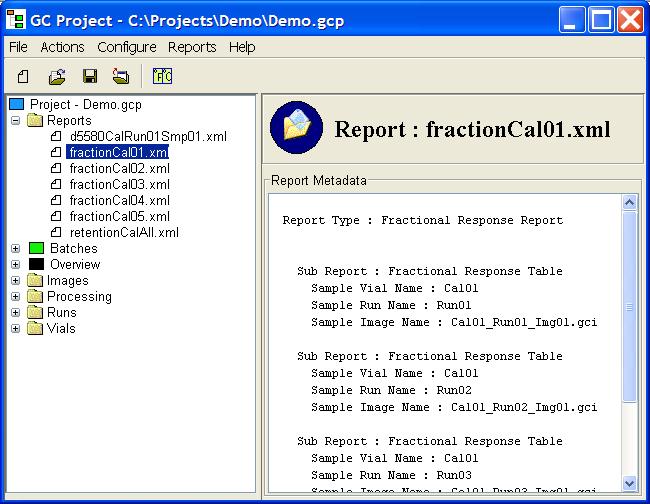
Clicking on a report under listed under the Reports node in the Project Tree presents in the Component Information pane information about the specific report, as shown in Figure 4. Double-clicking on a report listed under the Reports node in the Project Tree launches a file browser (MS Internet Explorer for reports formatted in XML and HTML and MS WordPad for reports formatted in CSV).
GC Project allows users to designate a set of processed images as a Batch. The U.S. Environmental Protection Agency (EPA) defines a batch as: "A group of samples which behave similarly with respect to the sampling or the testing procedures being employed and which are processed as a unit." [U.S. EPA, SW-846, Revision 2, 1996, p. ONE-23] Batches are a convenience in generating reports because the same set of processed images, e.g., a set of calibration images, may be used repeatedly in generating many reports. Once grouped in a batch, the set of images can be selected en masse for a report.
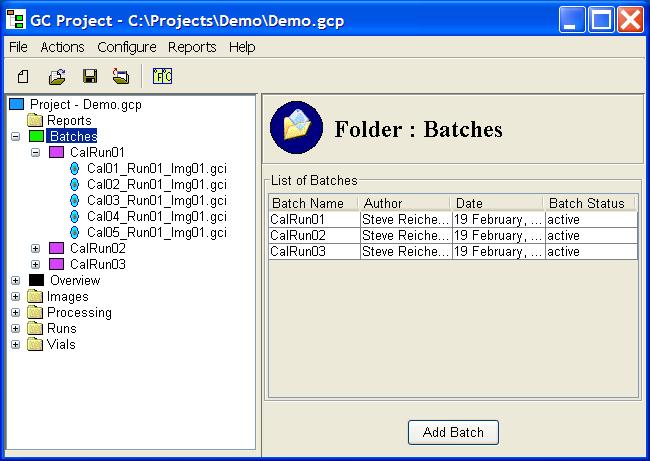
The Batch structure in GC Project contains a set of processed images. Each Batch defined for the project is listed under the Batches node of the Project Tree, as in Figure 5. Clicking on the Batches node of the Project Tree lists the table of batches in the Component Information pane.
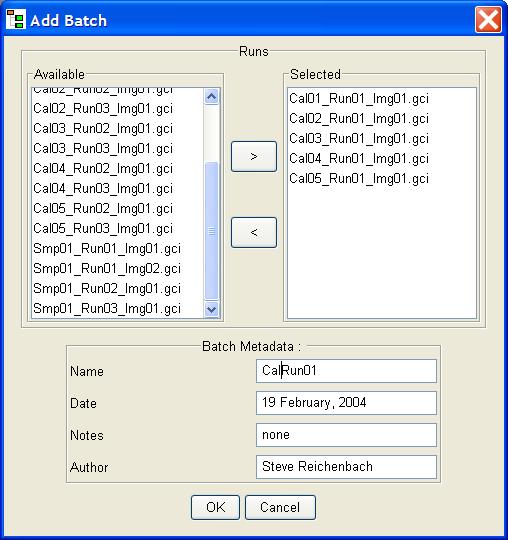
A user creates a new batch by clicking on the Add Batch button below the list of existing batches. GC Project presents a batch creation popup, pictured in Figure 6, that allows the user to specify the processed images in the batch. Once the processed images are selected, the new batch is created, it is added to the list of batches in the batch list in the Component Information pane, and it is added to the Project Tree under the Batches node.
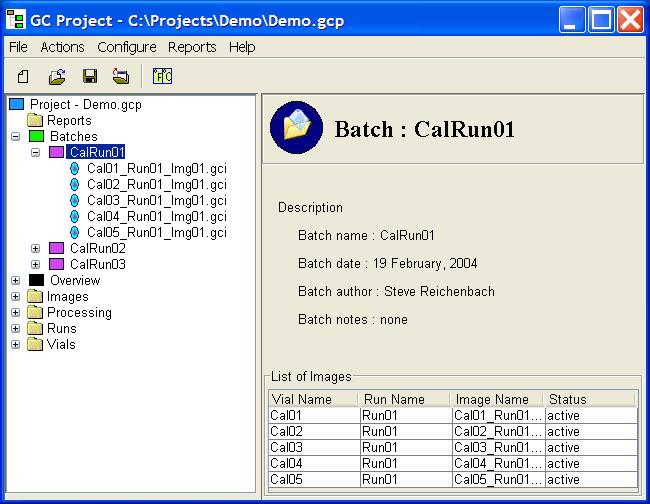
Clicking on a batch in under the Batches node of the Project Tree presents in the Component Information pane information about the batch, including the list of processed images, as illustrated in Figure 7.
The Fractional Response report provides the response (i.e., volume) of each included blob, group, constellation, and blob set as a percent of the sum of the responses (i.e., volumes) of all detected blobs which have not been excluded. The Fractional Response report expands on the percent response statistic in the blob table.
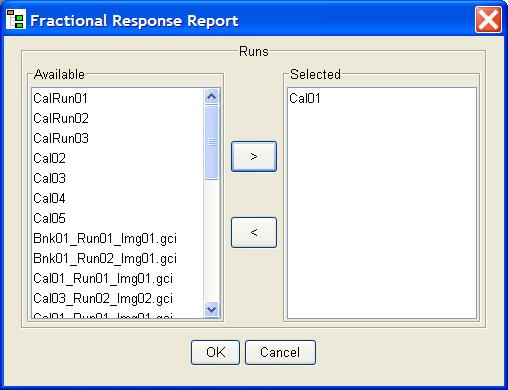
First, the user selects Fractional Response from the Reports menu of GC Project. Then, GC Project presents a chooser listing all of the batches and all of the processed images in the project, as illustrated in Figure 8. The user selects a batch or processed image by clicking on it in the Available list and then clicking the '>' button to select the choice. A selected batch or processed image can be deselected by clicking on it in the Selected list and then clicking the '<' button to deselect the choice. After selection is finished, the user clicks OK and is prompted for the output file format and name.
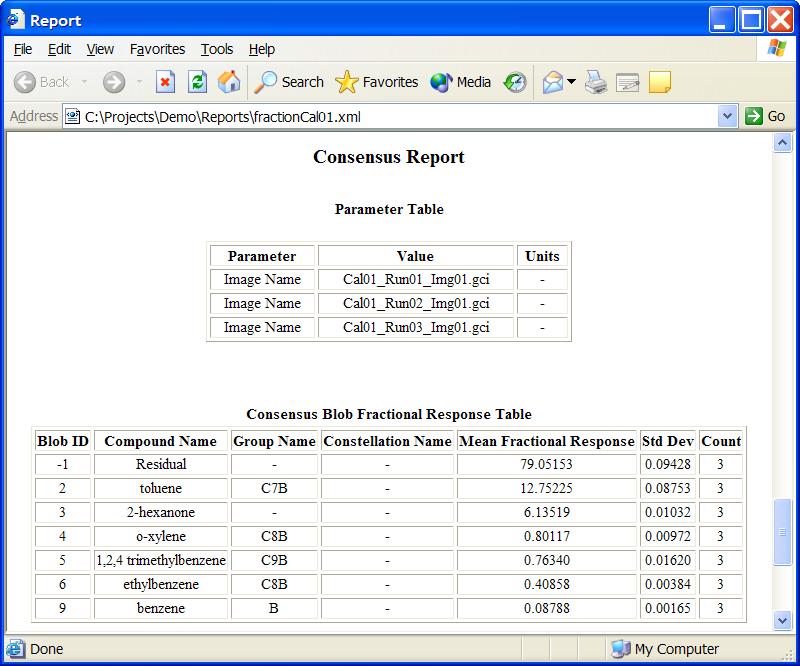
As shown in Figure 9, the Fractional Response Report for a processed image has:
If a batch with multiple processed images is selected for the report, all of the images in the batch are reported in sequence. Then, at the end of the report, there are consensus blob, group, constellation, and blob-set tables with mean, standard deviation, and count for each row in each table.
The Retention Time report provides a formal report format for the peak retention times. The Retention Time report is a more formal formatting of the peak retention-time statistics in the blob table.
First, the user selects Retention Time from the Reports menu of GC Project. Then, GC Project presents a chooser listing all of the batches and all of the processed images in the project. The user selects a batch or processed image by clicking on it in the Available list and then clicking the '>' button to select the choice. A selected batch or processed image can be deselected by clicking on it in the Selected list and then clicking the '<' button to deselect the choice. After selection is finished, the user clicks OK and is prompted for the output file format and name.
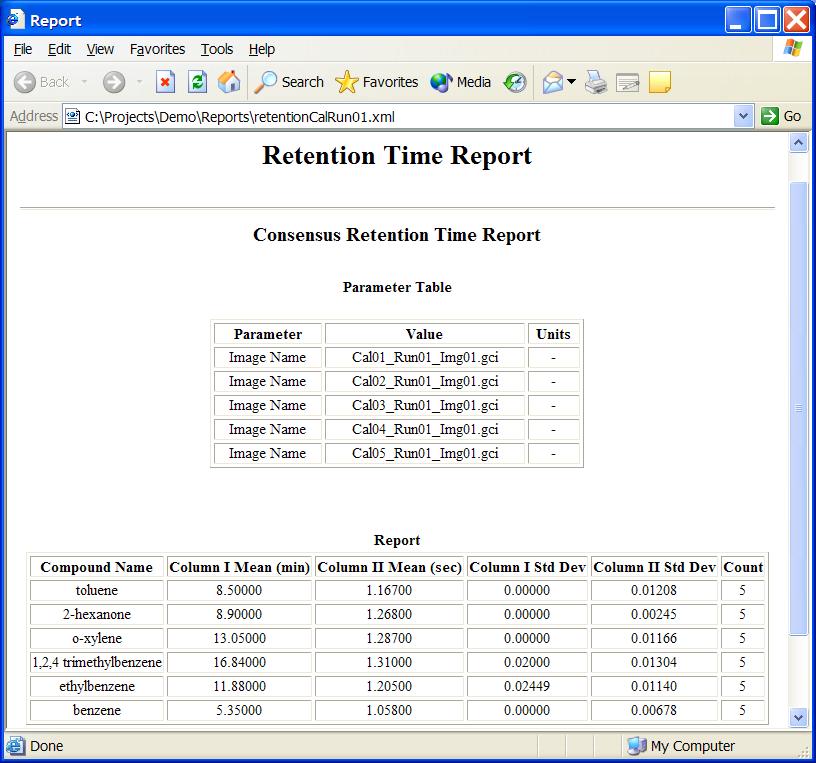
As shown in Figure 10, the Retention Time Report for a processed image has:
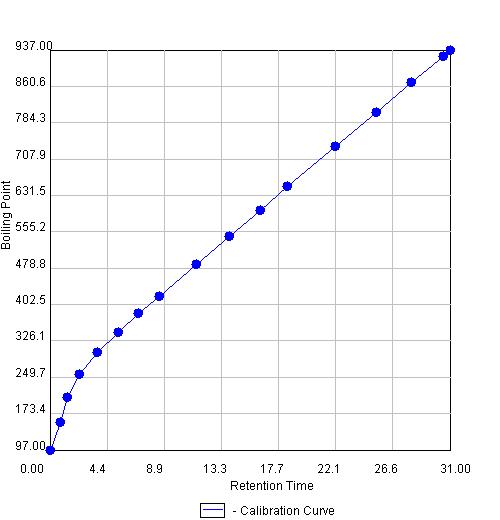
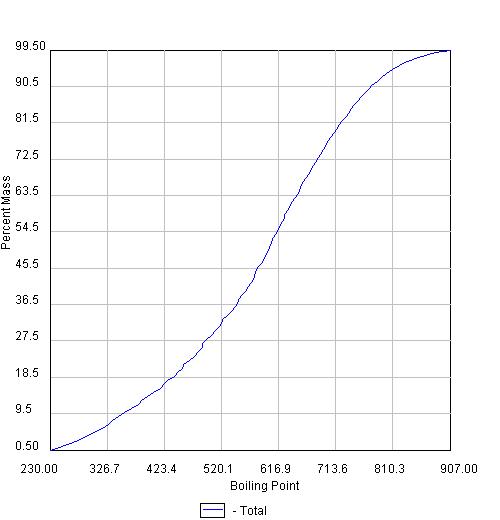
Slice reports, such as ASTM D2887, report the retention time and boiling point distribution. This report requires a calibration run, with included blobs of known boiling point, and a sample run, for which the distribution is reported. (The report requires that named chemicals in the amount table of the calibration vials also are present with boiling points in the chemical properties table.)
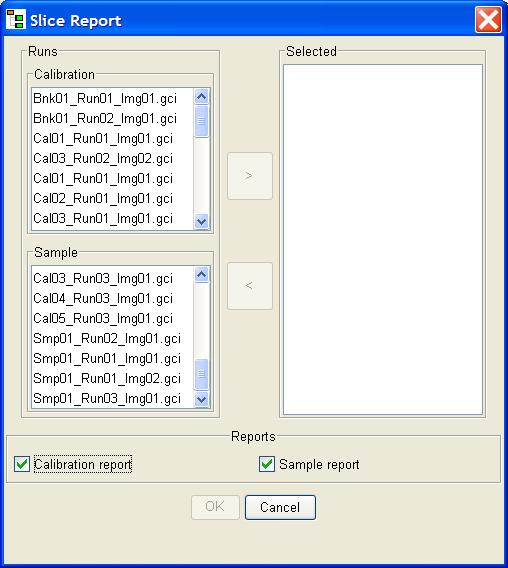
First, the user selects ASTM D2887 or Slice from the Reports menu of GC Project. Then, GC Project presents a chooser, pictured in Figure 11. The chooser for Slice reports requires selection of a calibration and sample pair. The user selects a processed image for each by clicking an entry in the Calibration list and an entry in the Sample list, then clicking the '>' button to select the pair. A selected pair can be deselected by clicking on it in the Selected list and then clicking the '<' button to deselect the choice.
The user also selects from the various sub-reports available, e.g., calibration report, sample report, etc. After all selections are made, the user clicks OK and is prompted for the output file format and name.
The Slice report for a processed image has:
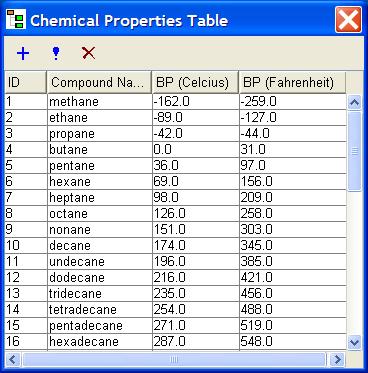
The Chemical Properties table has named chemicals and various chemical properties. The table currently is used for the Slice report to calibrate boiling point. The table will be expanded significantly to include other chemical properties required for analysis and reporting. To view and edit the Chemical Properties table, click the Chemical Properties button on the GC Project toolbar. Figure 14 illustrates the Chemical Properties tool with buttons that allow adding new entries, editing existing entries, or deleting entries.
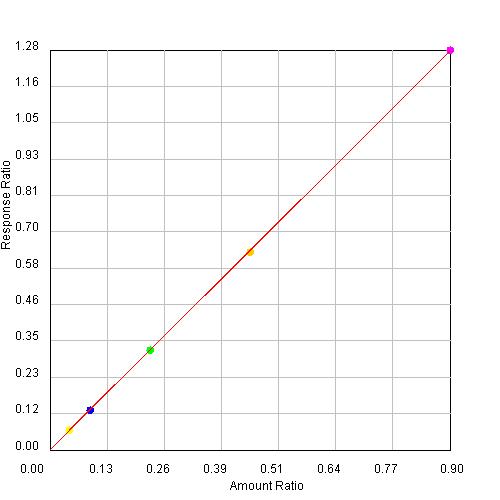
Internal Standard reports, such as ASTM D5580, report the amounts of compounds in a sample relative to internal standards. This report requires calibration runs, with known ratios of target compounds and internal standards, and a sample run, which includes a known amount of internal standards and a known amount of sample. (An entry with the name "Sample" and the amount or relative amount of the sample should be present in the amount table of each sample vial.)
First, the user selects ASTM D5580 or Internal Standard from the Reports menu of GC Project. Then, GC Project presents a chooser. The chooser for Internal Standard reports requires selection of a calibration batch and sample pair. The user selects the calibration batch by clicking in the Calibration list and a sample by clicking in the Sample list, then clicking the '>' button to select the pair. A selected pair can be deselected by clicking on it in the Selected list and then clicking the '<' button to deselect the choice.
The user also selects from the various sub-reports available, e.g., calibration report, sample report, etc. After all selections are made, the user clicks OK and is prompted for the output file format and name.
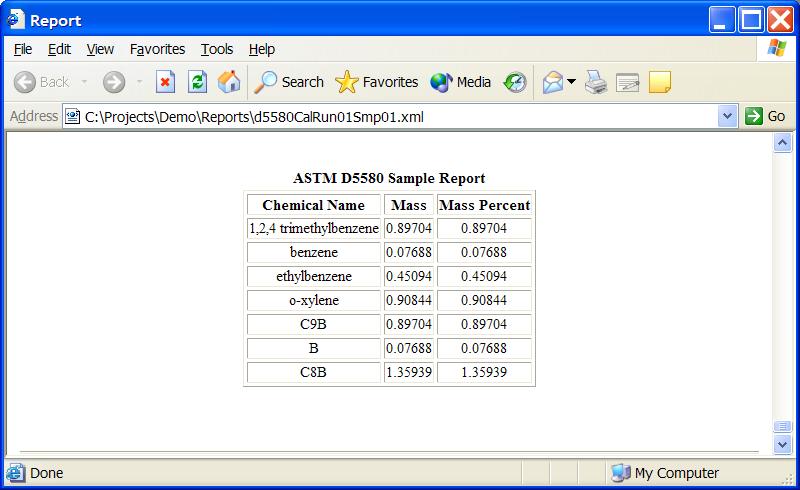
The Internal Standard report for a processed image has:
Contents
Previous: Project Management
Next: Help Resources
GC Image™ Users' Guide © 2001–2004 by GC Image, LLC, and the University of Nebraska.