The GC Project graphical user-interface (GUI) is pictured in Figure 1. At the top of the interface are the title bar, menu bar, and tool bar. The lower-left pane contains the Project Tree that visualizes and provides access to the project components. The lower-right pane presents Component Information about the user-selected components and provides access to component operations.
The user creates a new project by clicking the New Project button on the tool bar or from the File menu of GC Project. The user specifies the directory location and the project name. GC Project creates a new folder with the project name in the user-specified directory. In the project directory, GC Project creates a GC Projects file (.gcp extension) and several subdirectories (described below).
The File menu supports saving a project, opening a previously saved project (from the .gcp file), closing a project (without saving), and exiting. The tool bar has corresponding buttons for saving, opening, and closing projects.
The Project Tree presents subtrees for each of several components of a project:
The Vial structure encapsulates basic data and metadata about the mixtures analyzed by GCxGC. For example, the ASTM D2887 analysis may involve two mixtures:
Just as the physical vial contains the actual chemical mixture, so the Vial data structure contains data and information about the mixture that is analyzed. The basic data about the vial includes a Composition Table of the known chemical compounds and the (relative or absolute) amounts. The vial metadata includes creator, date, and notes.
GC Project currently supports several operations on vials:
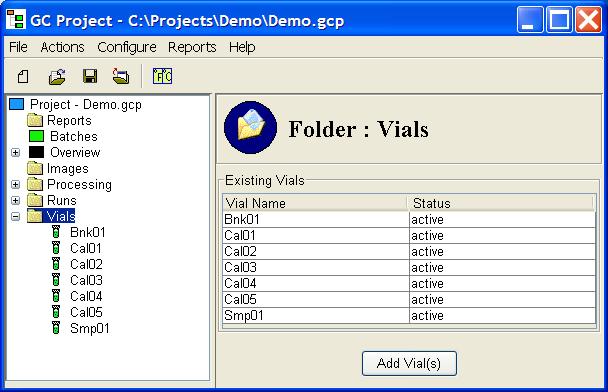
The Project Tree pane (lower-left) of GC Project contains a Vials node, as pictured in Figure 2. If the node has a '+', then it can be expanded by clicking to list the vials as leafs in the tree. If the node has a '-', then it can be collapsed so that the list of vials is not shown. If there is neither a '+' nor '-', then there are no vials in the project.
A user views the list of all vials in the project by clicking on the Vials node in the Project Tree. Then, the list of all vials is presented in the Component Information pane (lower-right), as in Figure 2. The list shows the name and status of each vial. Below the list of vials is a button to create a new vial(s). Additional functionality, such as controls for vial status, will be added in the future.
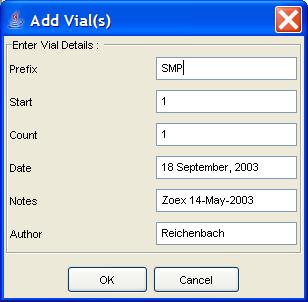
A user creates a new vial by clicking the Add Vial button below the list of vials. GC Project presents a vial creation popup, pictured in Figure 3, that allows the user to specify the root-name of the vial, a starting sequence number for the vial, the number of vials to be created (with the sequence number incremented for each new vial), and vial metadata. If there is a CSV-format composition table with the same name as the vial (e.g., cal01.jpg), the user is prompted whether to read the table. Once a new vial(s) is created, it is added to the list of vials in the vial list and is also added as a leaf node in the Project Tree under the Vials node.
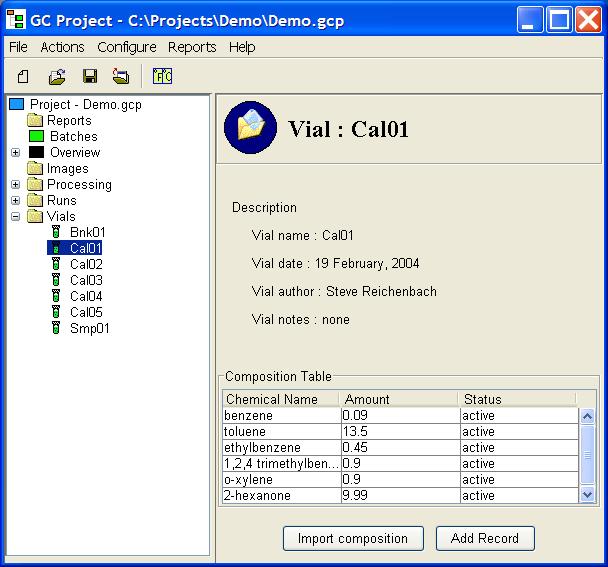
A user views the information about a specific vial by clicking on the Project Tree leaf node corresponding to the desired vial. Then, data and metadata for the vial, including Composition Table, creator, date, notes, and status, are presented in the Component Information pane, as in Figure 4.
Below the vial information in the Component Information pane are two buttons for manipulating the Composition Table:
Currently, GC Project can import composition files in
comma-separated value (CSV) text format with each line formatted as
"
Clicking the Add Record button presents a popup dialog, pictured in
Figure 5, in which the user types the compound name and amount.
A typical process for creating a vial and importing its composition table
follows. (The same process can be followed for creating multiple vials.)
If the CSV file does not have the same name as the vial, two additional
steps are necessary.
To fully incorporate a chromatogram into a project, the user must associate
the run with a vial (created as described above). Each run is associated
with a single vial, but a vial may have multiple runs from it.
The color of the dot next to each chromatogram run in the Project
Tree indicates whether or not an association has been made for that
run.
A red dot indicates that there is no vial association for the run
and a green dot indicates there is a vial association.
Clicking on the Runs component of the Project Tree
presents in the Component Information pane a table of runs
that have been associated with a vial, as shown in Figure 6.
Each associated run in the table has the data file of the
chromatogram, the associated vial name, and a sequence number
for the run. The sequence number is automatically assigned when
the run is associated with the vial.
As pictured in Figure 6, the Component Information pane for
Runs also contains a GUI for associating unassociated runs with
specific vials.
To make an association between a vial and one or more runs, select
a vial from the list of vials, select a run(s) from list of runs, and
then click the Associate button.
Then, the run(s) are removed from the list of unassociated runs and
added to the table of associated runs (with vial name and sequence
number), and the color of the dot(s) in the Project Tree are
changed from red to green.
To unassociate a run from a vial, select the run from the list of
associated runs, then clock the Unassociate button. The run
is removed from the list of associated runs and added to the list
of unassociated runs, and the color of the dot in the Project
Tree is changed from green to red. The unassociate operation
is not allowed if the chromatogram has been processed into an image
which may have been used in a report.
When it is invoked by GC Project to import a chromatogram,
GC Image creates a processed image in the Images subdirectory
and makes an association between the image and the run.
Multiple processed images may be created for a single chromatogram run
(e.g., to test different processing parameters), but each processed
image is associated with a single chromatogram run. The processed
images are named with an image sequence number for the run.
For example, Cal01_Run03_Img02 is the name for the second
image created for the third run from the vial named Cal01.
All of the images in the project are listed under the Images
node in the Project Tree, as illustrated in Figure 7.
Clicking on the Images node in the Project Tree presents
in the Component Information pane a table of images in the
project with the status of each.
Clicking on an image listed under the Images node in the
Project Tree presents in the Component Information pane
information about the specific image, such as its dimensions and an
overview of the processing information, as shown in Figure 8.
Double-clicking on an image listed under the Images node in the
Project Tree opens the image in GC Image.
GC Image allows the user to designate a group of runs to be processed
in an identical fashion. Choosing the Process Group option on
the Actions menu presents the dialog pictured in Figure 9.
The dialog is similar to the import dialog described in chapter
Configuration Files, except that the
user can choose multiple runs to be processed and that the process
automatically saves the resulting image and exits. GC Image is invoked
for each image and processing continues, as long as there are no
unexpected errors or warnings (e.g., incomplete template matching),
until all runs are processed. If a warning occurs, the user should
finish processing the run interactively, then save and close the image
and exit the instance of GC Image.
Automated group processing will continue with the next run.
The Review Group option on the Actions menu allows
the user to select a group of images for review. GC Image is
started to open each image. The user is left to process and save
each image interactively, if desired, and then exit the instance
of GC Image, at which point the next image is opened for review.
Figure 10 illustrates the Review Group dialog.
Clicking on a vial listed under the Overview node in the
Project Tree presents in the Component Information pane
information about the specific vial, such as its composition table,
and a table of the runs from the vial.
Clicking on a run listed under an Overview->Vial node in the
Project Tree presents in the Component Information pane
information about the specific run, including a table of images for
the run.
Clicking on an image listed under an Overview->Vial->Run node in
the Project Tree presents in the Component Information pane
information about the specific image.
Double-clicking on an image listed under an Overview->Vial->Run node
in the Project Tree opens the image in GC Image.
Contents
Previous: GCxGC-MS Data
Next: Reports
GC Image™ Users' Guide © 2001–2004 by GC Image, LLC, and the University of Nebraska.
benzene, 0.09
Compound names containing commas should be enclosed in quote marks.
If the CSV file with the vial name exists when the vial is created,
the user is queried with the option to import the file.
2-hexanone, 9.99
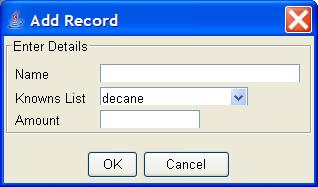
Figure 5: The Add Record popup dialog to add a
record to the composition table.
At this point, if the CSV file has the same name as the vial, then the
user confirms importation of the composition table and the process is
complete. Once created, the new vial is listed in the Project Tree
under Vials.
Runs
The Run structure encapsulates information about the raw chromatograms
that are produced in a run (i.e., each run of the instrument creates
a single chromatogram).
The raw data for all of the chromatograms are stored in the Runs
subdirectory and each chromatogram in the Runs subdirectory
is listed in the Project Tree under the Runs component,
as illustrated in Figure 6.
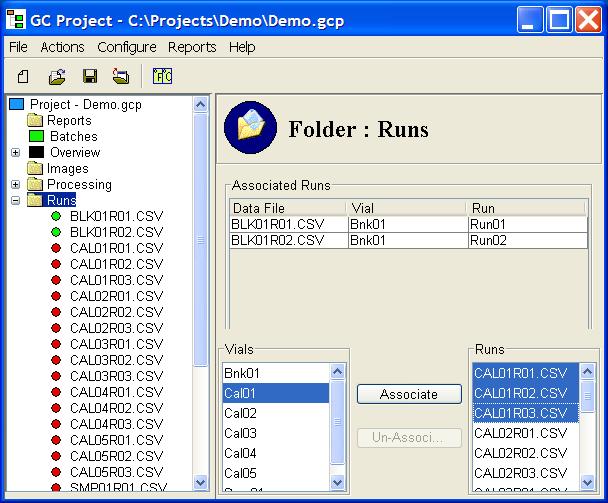
Figure 6: The Runs node in the Project Tree.
Processing and Images
After associating a run with a vial, the user can initiate processing
of the chromatogram. To initiate processing a chromatogram, double-click
on the chromatogram in the Project Tree. The user is presented
with a dialog for importing a chromatogram.
In the import dialog, the user must supply the dimensions of the GCxGC
data, may specify a configuration file, and may specify immediate
processing (including background removal, blob detection, and template
matching).
The Processing subdirectory for the project is provided as
a convenient location for configuration file(s) and blob template(s)
used in processing.
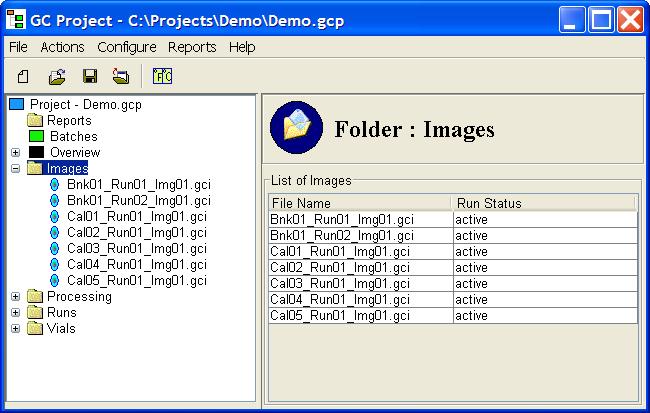
Figure 7: The Images node in the Project Tree.
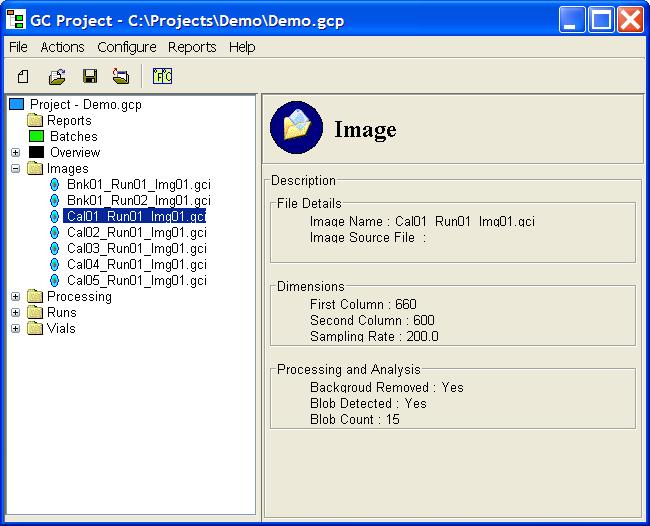
Figure 8: An Image node in the Project Tree.
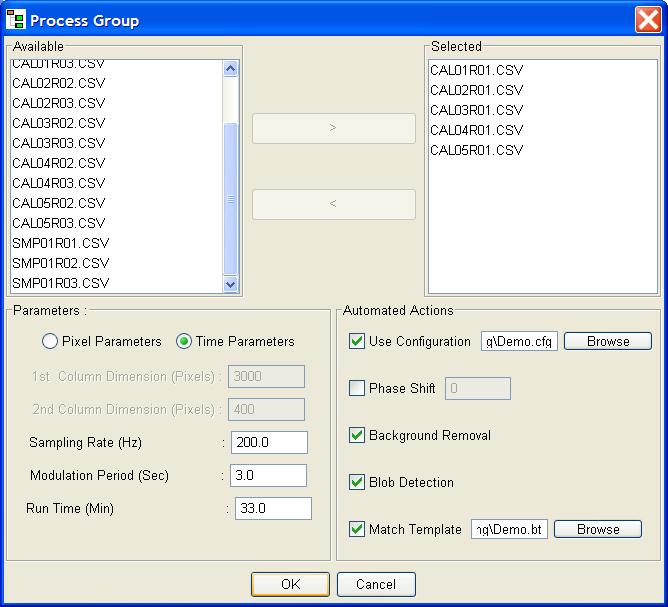
Figure 9: The Process Group dialog.
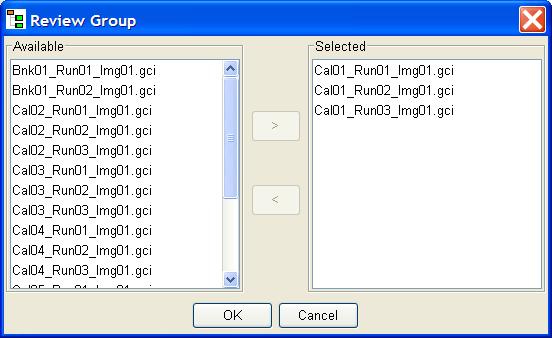
Figure 10: The Review Group dialog.
Overview
The Overview in the Project Tree presents the hierarchy
of vials, runs, and images, as pictured in Figure 11.
A project may have one or more vials, each of which may have one or
more runs, each of which may have one or more images.
Clicking on the Overview node in the Project Tree presents
in the Component Information pane a table of the vials in the project.
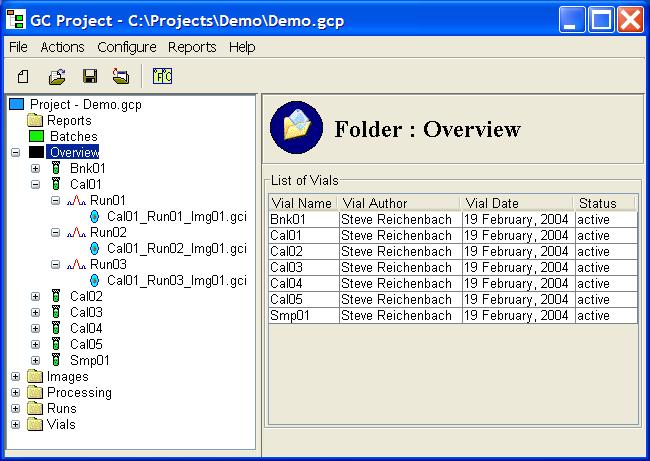
Figure 11: The Overview in the Project Tree.
Batches and Reports
The end product of an analysis is typically a report on the processing
of a set or batch of runs.
GC Project provides tools for creating and managing batches and
reports.
These batch and reporting tools of GC Project are described in
chapter Reports.