GC Image Users' Guide
Detection and Analysis
After correcting the baseline, the individual blobs of pixels associated
with the separated chemicals typically must be detected and accurately
quantified. In image processing, each such group of pixels is called
a blob and the operation of grouping pixels into blobs is called blob
detection. GC Image implements blob detection and various tools for
displaying, analyzing, and editing blobs.
Detect Blobs
To detect and quantify blobs in the image, invoke the Detect Blobs
operation, either by clicking the Detect Blobs button on the
Image Viewer tool bar or selecting the Detect Blobs item
from the Filter menu.
The blob detection operation takes a brief time (typically no more
than a few seconds) and does not change the image.
The blob detection algorithm uses a greedy dilation that successively
attaches the largest-valued unassigned pixel to a neighboring blob or
forms its own blob if no neighboring peak has been established.
Configure->Configure Settings on the Image Viewer menu bar
provides parametric settings for Blob Detection:
-
Before the algorithm is run, the data values are smoothed to reduce
spurious variations associated with noise. The smoothing is considered
only during the detection algorithm and no pixel values are actually changed.
The widths of the Gaussian blurring filter is configurable. The default
width parameters are 0.5 pixels in the first column direction and 2.0
pixels in the second column dimension. The minimum values are 0.0.
Larger values tend to produce more errors where two adjacent peaks
are detected as a single peak, whereas smaller values tend to produce
more errors where a single peak is detected as two separate peaks.
-
The blob detection algorithm implements a post-processing filter to
eliminate detected blobs that have either an area (number of included
pixels) that is too small or a maximum peak value that is too small.
The default minimum area is 22 and the default minimum peak is 5.0
times the estimated standard deviation of the noise. The minimum
value for these configurable parameters is 0.
The Detect Blobs operation may detect hundreds or even thousands
of separate blobs in the image.
There are a number of important tasks in analyzing the large volume
of blob data.
-
A user may wish to identify and report on only a fraction of the
chemicals in the sample, so one of the tasks of analysis is to
designate those blobs that are to be included for reporting.
-
In a report, the blob data usually should be associated with the
name of the chemical that produced the blob and/or the chemical group
that produced the blob, so one task of analysis is to identify the
blobs by associating chemical names and/or chemical group names with
the blobs to be included for reporting.
-
Calibration of the system and accurate quantification of peaks
may require the identification of internal standards (chemicals
of known quantity injected into the sample mixture) and the
association of sample chemicals with specific internal standards.
So, analysis may require the identification of blobs produced by
internal standards and the correct associations between sample blobs
and internal standard blobs.
-
Ideally, blobs are well separated and correctly distinguished in
the Detect Blobs operation.
In practice, imperfections due to noise and small proximity between
peaks can lead to detection errors that require editing.
So, another analysis task may be to correct mistakes in the detection
of blobs to be included for reporting.
GC Image allows users to interactively assign chemical names, chemical
group names, internal standard associations, reporting status, and
other metadata to individual blobs or groups of blobs. Other GC Image
tools support interactive editing of detected blobs. However, the
large number of separated chemicals in GCxGC data makes manual analysis
tedious and time-consuming. Automated tools are essential for efficient
processing of large GCxGC data sets.
GC Image has tools that automate much or all of the analysis process.
The approach is based on pattern matching: a template that describes
the pattern of chemicals peaks in one image can be matched automatically
to the blobs of subsequent images. Then, the chemical names, chemical
groups, and internal standard associations in them template are copied
to blobs in the target image. Similar patterns of blob peaks are
seen in runs of similar samples under similar conditions, so templates
can be used to make accurate chemical identifications based on previously
observed patterns.
Display Blobs
GC Image graphically highlights detected blobs in the Viewport
of the Image Viewer with a variety of settings accessible via
Configure->Configure Settings on the Image Viewer menu bar.
-
Configuration settings determine whether graphical highlights for
blobs are shown in other cursor modes (e.g., graphics mode).
The default is to show blob highlights in all modes except template
mode.
-
A configuration setting determines whether graphical highlights are
displayed for each of the three classes of blobs:
- Unflagged — blobs that are detected, but neither
designated as included nor designated as excluded for reports.
(The meanings of inclusion and exclusion are described next.)
This is the initial state for all blobs.
- Included — blobs that are designated to be included
in reports. Reports are to individually characterize (in the manner
appropriate for the type of report) all included blobs.
- Excluded — blobs that are designated as excluded in
reports. Reports may include in computations blobs that are not
designated as included. Excluded blobs are excluded from such computations.
For example, a fractional response report will characterize the fractional
response of each included blob to the total responses of all included
and unflagged blobs, but will not include excluded blobs in the total.
The default is to graphically highlight all blobs using different colors
for each class.
-
A configuration setting determines whether the graphical highlighting
for each blob is a thin outline, a thick outline, a filled outline, or
a bounding box. The default is to highlight with a thin outline.
-
A configuration setting determines whether or not associations between
sample chemicals and associated internal standards are highlighted with
a line between the blob peaks. The default is to highlight the
internal standard associations with a line.
-
Configuration settings determine the colors used for included blobs
(default cyan), excluded blobs (default gray), unflagged blobs (default
red), internal standard blobs (default orange), internal standard
association lines (default green), and selection box (yellow).
Also, after blob detection, when the cursor lingers over a blob in the
Image Viewer a tool tip appears with information about the blob.
An example of the graphical highlights is shown in Figure 1.
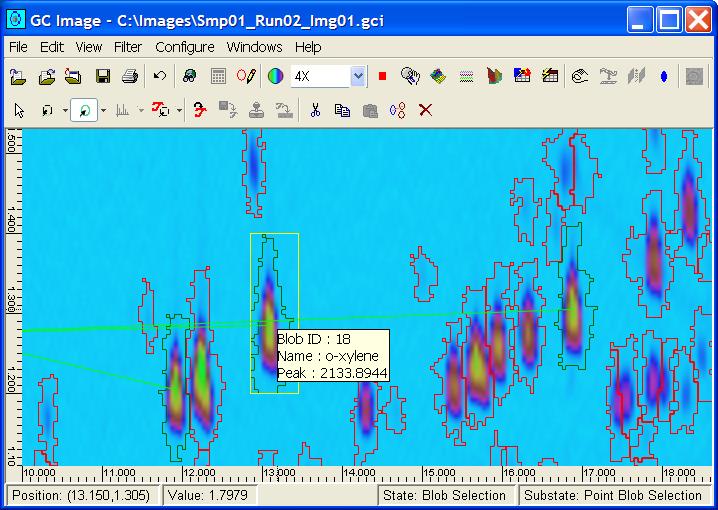
Figure 1: Graphical highlights show the included
blobs, internal standards, and associations between included
blobs and internal standards.
The configuration panel for blob display is shown in Figure 2.
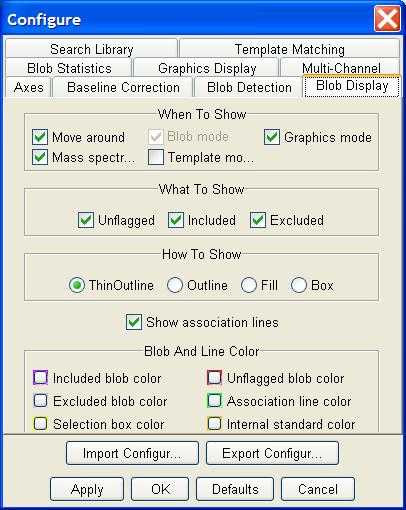
Figure 2: Blob display configuration panel.
Selecting Blobs
The Image Viewer palette has four cursor modes for selecting
blobs and one mode for drawing a blob:
- Point blob selection,
- Polyline blob selection,
- Rectangle blob selection,
- Polygon blob selection, and
- Draw blob.
The Blob Mode button, located on the Image Viewer palette,
shows only the current or most recent blob-selection mode. The Blob
Mode can be changed from the pull-down menu that is adjacent to the
Blob Mode button. Figure 3 shows the Blob Mode
button on the Image Viewer palette.
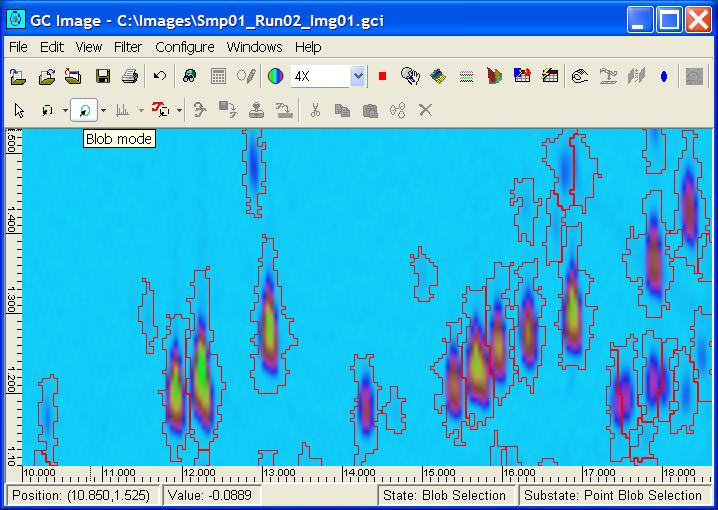
Figure 3: The cursor modes for blobs are set from
a button on the Image Viewer palette.
In point blob-selection mode, a blob is selected by moving the cursor
over any pixel inside the border of the blob and clicking the left
mouse-button.
Once a blob is selected in pixel blob-selection mode, other blobs can
be added to the selection set by depressing the control key and
clicking of the left mouse-button while the cursor is inside the next
blob to be selected.
In polyline blob-selection mode, blobs are selected by intersection
with a drawn polyline. To draw a polyline, locate the cursor at the
starting point of the polyline and click the left mouse-button. Then,
similarly locate each successive point of the polyline and click the
left mouse-button. At the ending point of the polyline, double-click
the left mouse-button. All blobs intersected by the polyline will be
selected.
In rectangle blob-selection mode, a group of blobs can be selected by
moving the cursor to a point above (or below) and left (or right) of
the peaks of all blobs to be selected, depressing the left mouse-button,
moving the cursor below (or above) and right (or left) of the peaks of
all blobs to be selected and releasing the mouse button. All blobs
with the peak pixel in the rectangular bounding box will be selected.
In polygon blob-selection mode, a group of blobs can be selected by
moving the cursor to a point near the blobs to be selected, clicking
the left mouse-button, repeatedly moving the cursor around the blobs
to be selected and clicking the left mouse-button (drawing a polygon),
and double clicking the left mouse-button (to close the polygon).
All blobs with the peak pixel in the polygon will be selected.
The blob(s) that are selected are highlighted with a colored box.
Figure 4 shows a selected blob with a mouse-over that shows
information about the blob.
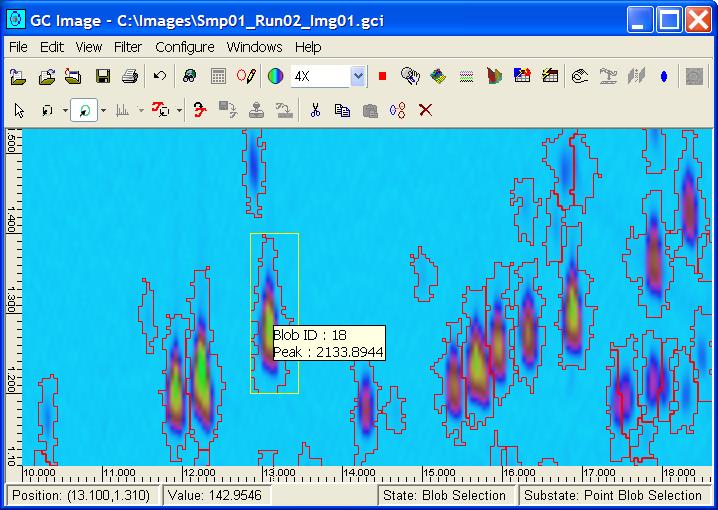
Figure 4: Selected blobs are highlighted by a box.
All blobs may be selected by first setting the cursor mode to Blob
Mode and then choosing Edit->Select All. Two additional
tools for selecting blobs by user-specified criteria — Find
Blobs and Filter Blobs are described below. Another
tool selection tool is available for multi-spectral images, described
in chapter GCxGC-MS Images.
Drawing, Excluding, and Editing Blobs
Automated blob detection sometimes fails to correctly detect blobs.
For example, detection may fail to identify a blob or detection may
split what should be a single blob or detection may join what should
be two separate blobs. If blob detection results in many errors, it
is best to undo blob detection and try different detection parameters.
If only a few blobs are detected incorrectly, it is possible to
manually draw outlines of blobs that were missed, to exclude incorrect
blobs (removing them from reporting) and then redraw the outline,
or to edit blobs in various other ways. Note that such editing does
not change the data, only blob outlines.
One of the blob cursor modes for blobs is Draw Blob mode. In blob
draw mode, the user delineates the blob outline in the Viewport
by depressing the left mouse-button on the border of the new blob,
moving the cursor along the desired outline of the blob, and releasing
the cursor at the end of the outline (causing the outline to be closed
and all unassigned interior pixels to be assigned to the new blob).
If a new blob is drawn to overlap another blob, the pixels in the
overlapping region(s) will not be assigned to the new blob unless the
blob that is overlapped has been flagged as excluded from reporting.
To flag blob(s) as excluded, select the blob(s) to be excluded and
then click the Delete / Exclude Object button on the palette.
Confirmation for excluding blob(s) is required. A blob that is
flagged as excluded will be treated in reporting as if it was not
detected, but excluded blobs are maintained in the data, so it is
possible to remove the exclusion flag or to examine the data
for the presence and history of excluded blobs. Blobs flagged as
excluded lose their claim to pixels. For example, suppose that Blob A
is flagged as excluded and then Blob B is defined to contain pixels
also contained in Blob A. Then, if the exclusion flag is removed
from Blob A, Blob A does not reclaim pixels that now are contained in
Blob B.
The Edit Blobs tool, available in the Edit menu in the
Image Viewer, is a specialized interface for drawing, excluding,
and/or editing blobs. Figure 5 illustrates the Edit Blobs
tool.
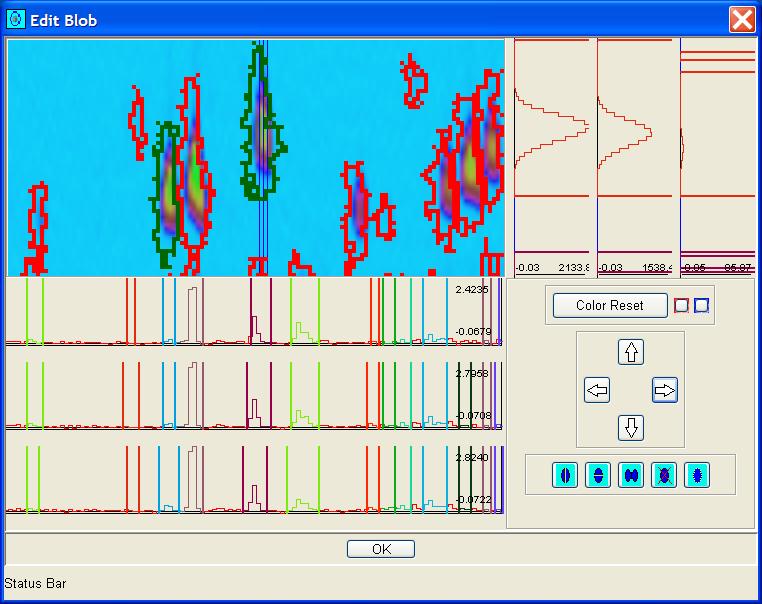
Figure 5: The Edit Blobs tool allows a variety
of actions, including excluding and redrawing blobs.
The first step in using the Edit Blobs tool is to select a
blob in the Image Viewer (as described above using one of the
blob-selection modes from the palette) or to select a rectangular
sub-region of the image (as described in chapter
Graphics).
After a single blob or a rectangular sub-region is selected,
start the Edit Blobs tool from the Edit menu in
the Image Viewer.
The Edit Blobs tool resembles the Multi-Projections
tool in that it has a sub-image in the upper-left, graphs of slices
of rows in the bottom-left, graphs of slices of columns in the
upper-right, and a control pane in the lower-right.
The sub-image can be shifted by click-and-drag in the sub-image.
The Edit Blobs tool can be resized to show a larger or
smaller sub-image, but the resolution is fixed.
The Edit Blobs tool shows three row and three column slices.
The cross-hairs indicate the three row and three column slices
in the sub-image that are graphed. The cross-hairs can be relocated
in the sub-image by depressing the shift key and clicking the left
mouse-button on the desired location. The cross-hairs can be moved
incrementally with the four arrow buttons on the Edit Blobs
control pane.
Blobs along the sliced rows and columns can be edited in one
dimension by moving the delimiters at the edge of the blob.
The delimiters are moved by clicking with the left mouse-button
and dragging to the desired location.
The change in the blobs outline can be seen both in the slice
and in the sub-image.
If a shared delimiter is moved, both blobs are affected.
The Edit Blobs control pane has five additional buttons
for editing blobs.
There are buttons for splitting the blob at the center of the
cross-hairs either horizontally or vertically along the cross-hair.
Pressing these buttons will split the blob in the specified
direction.
There is a button for excluding the blob at the center of the
cross-hairs.
Pressing this button will flag the target blob as excluded in reporting.
There is a button for merging two blobs.
After pressing the button to merge blobs, the blob at the center of
the cross-hairs is merged with the blob indicated subsequently by
pointing the cursor and then shift-click with the left mouse-button.
There is a button for drawing a new blob.
After pressing this button, locate the cursor on the desired
border of the new blob, depress the left mouse-button, move the
cursor along the desired outline of the blob (drawing an outline),
and release the cursor at the end of the outline.
Blob Metadata and Computed Attributes
GC Image maintains computed attributes and metadata about each blob.
The computed attributes include maximum peak value, retention times
of the peak, etc. The metadata includes:
- chemical name,
- chemical group name,
- constellation name,
- whether the blob is to be included or excluded in reporting, and
- the internal standard associated with the blob,
None of the metadata values are set during blob detection; all metadata
are set with information provided during analysis.
To set the metadata for a blob, it must first be selected.
After one or more blobs are selected, a click of the right mouse-button
will invoke a popup dialog box for editing the metadata, such as
illustrated in Figure 6.
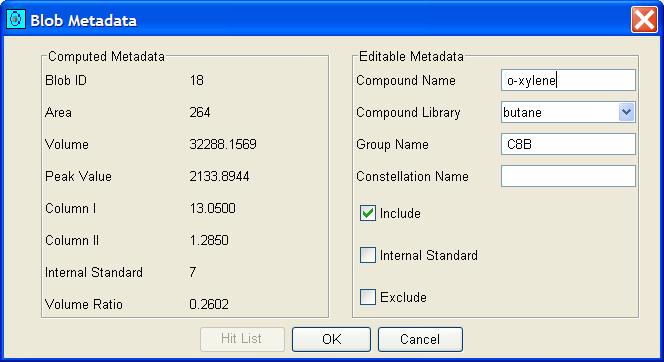
Figure 6: The Blob Metadata popup dialog displays
and allows setting of metadata about the blob, including
chemical name, group name, etc.
The Blob Metadata popup dialog for a single blob displays the
blob's unique ID number and several computed attributes:
- ID - a unique identification number assigned by GC Image,
- Area - the number of pixels in the blob,
- Volume - the sum of the values of the pixels in the blob,
- Peak value - the largest value of the pixels in the blob,
- Peak location - the coordinate of the peak value in each dimension,
- Internal standard - the label of the internal standard (0 if not set),
- Volume ratio - the ratio between the volume of the blob and the
volume of the associated internal standard,
If a single blob is selected, the popup dialog displays the current
values for the chemical name, chemical group name, and constellation
name and allows those values to be changed. For a single blob, there
are also checkboxes to indicate whether or not the blob is to be
included in reporting, whether or not the blob is an internal standard,
and whether or not the blob is to be excluded in reporting. (A blob
can be included or excluded, or neither, but not both. A blob that is
an internal standard must be included in reporting.)
If multiple blobs are selected, the popup dialog does not display
the values specific to individual blobs. If multiple blobs are selected
the popup, illustrated in Figure 7, allows setting only the
chemical group name and constellation name (with the values applied
to all selected blobs), whether or not the selected blobs are to be
included in reporting, whether or not the selected blobs are internal
standards, and whether or not the selected blobs are to be excluded
in reporting.
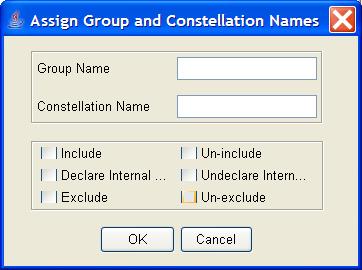
Figure 7: The Blob Group Metadata popup dialog
allows setting of metadata about a selected group of blobs.
The internal standard of a blob that is not itself an internal standard
is, by default, set to the nearest blob that is an internal standard.
The defaults are applied when blobs are included and when an internal
standard is included or excluded.
The internal standard of an included blob can be changed by selecting
the blob and cycling the association from one internal standard to the
next until the correct association is made.
Cycle the internal standard by first selecting an included blob (that
is not an internal standard) and then clicking the Cycle Internal
Standard from the tool bar or Edit menu of the Image
Viewer.
Blob Table
GC Image can present metadata and computed attributes for all blobs
in tabular form.
Clicking the Show Blob Table button on the Image Viewer
tool bar or selecting Blob Table from the View menu
invokes a sortable table with a row for each detected blob.
On each row is that blob's unique label, metadata, and computed
attributes.
Figure 8 illustrates a portion of an example blob table.
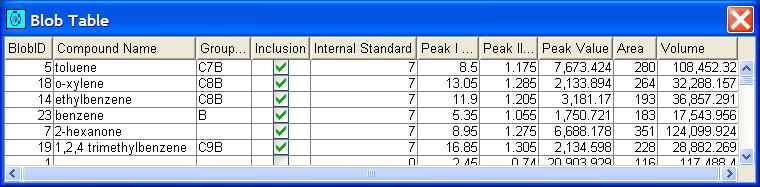
Figure 8: The Blob Table displays information
about each blob. The table can be sorted by clicking on a
column header.
The blobs in the table can be sorted in forward or reverse order by
clicking on the label at the head of the column to be used as the sort
key. (Consecutive clicks reverse the sort order.) Clicking to select
a row (or using shift-click to select a range of rows or control-click
to select multiple rows) causes the blob(s) selected in the Blob
Table to also become selected and highlighted graphically in the
Image Viewer.
GC Image supports more than 80 of computed attributes and metadata
for blobs.
The white paper, GCxGC Blob Metadata and
Statistics in GC Image, describes in detail each of the available
metadata and computed attributes in GC Image.
The blob table columns can be configured via the Configure->Configure
Blob Table on the Image Viewer menu.
The Configure Blob Table tool, pictured in Figure 9, allows
the user to add or remove columns from the blob table configuration.
Column(s) can be reordered by removing and re-inserting entries in a new
position.
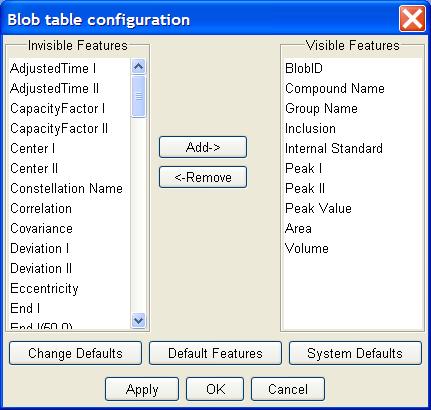
Figure 9: The Configure Blob Table allows the
user to select the columns of the blob table.
The blob table can be exported as a text file from the File->Save
Blob Table menu item on the Image Viewer. The exported
blob table will contain only the columns specified by the blob table
configuration. The blob table is saved as text in comma-separated-values
(CSV) format, which can be imported directly in the Microsoft Excel
and other data analysis software.
Blob Sets
Sets of blobs can be indicated by graphic objects, including points,
polylines, rectangles, and polygons. As described in chapter
Graphics, graphical objects can be flagged
to be included in reporting. Each graphical object that is flagged
for inclusion defines a blob set. Point graphics define the set of
blobs that contains the point. Polyline graphics define the set of
blobs that are intersected. Rectangle and polygon graphics define
the set of blobs whose peaks line in the graphic.
GC Image can present information about each blob set in tabular form.
Clicking the Show Blob Set Table button on the Image Viewer
tool bar or selecting Blob Set Table from the View menu
invokes a sortable table with a row for each blob set.
On each row is the blob set's unique label, name of the defining graphic,
number of blobs in the set, total volume of all blobs in the set, and
total fractional response of all blobs in the set. Currently, the
columns in the blob set table are not configurable.
Figure 10 illustrates an example blob set table.
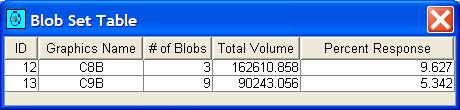
Figure 10: The Blob Set Table displays information
about blob sets. The table can be sorted by clicking on a
column header.
The entries in the table can be sorted in forward or reverse
order by clicking on the label at the head of the column to be used
as the sort key. (Consecutive clicks reverse the sort order.)
Clicking to select a row (or using shift-click to select a range of
rows or control-click to select multiple rows) causes the blob(s) in
selected blob set(s) to become selected and highlighted graphically in
the Image Viewer. Currently, the blob set table cannot be
exported.
Blob Selection and Analysis Tools
GC Image provides a Find Blobs tool, pictured in Figure 11,
for selecting blobs on the basis of blob ID, compound name, group name,
and constellation name.
For example, all blobs with a specific group name could be selected
en masse.
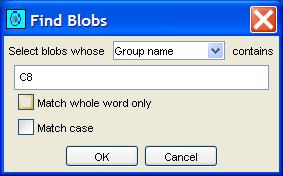
Figure 11: The Find Blobs tool allows
selection of blobs on based metadata.
GC Image provides a Filter Blobs tool, pictured in Figure 12,
for selecting (or deselecting) blobs on the basis of area, volume, peak
value, and volume ratio.
For example, all blobs with a sufficient peak height could be
selected en masse.
Similarly, all blobs with insufficient area could be deselected.
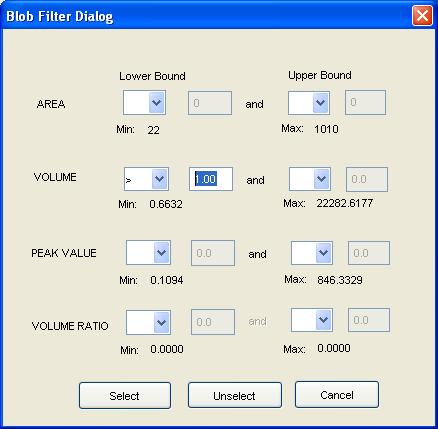
Figure 12: The Filter Blobs tool allows
selection or deselection of blobs on based on important
computed features.
GC Image provides a Visualize Blobs tool, pictured in
Figure 13, for graphing bi-variate relationships between
blob statistics and identifying blobs with statistical attributes.
For example, the tool can be set to show volume and peak value of each blob.
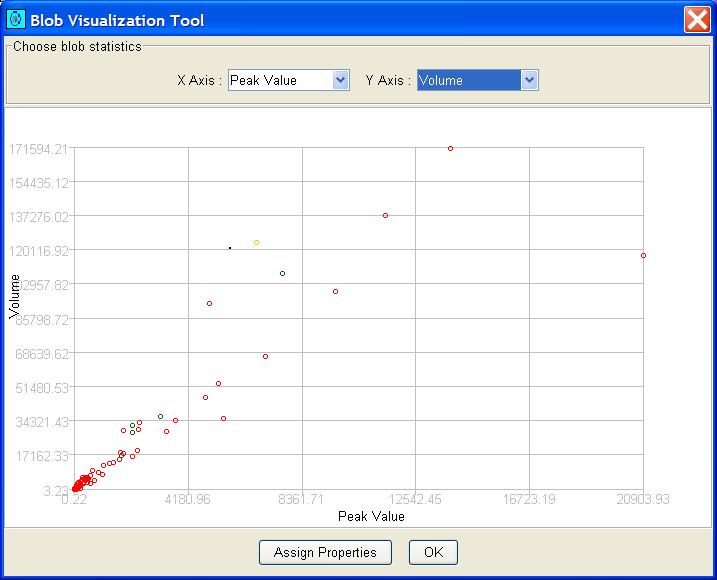
Figure 13: The Visualize Blobs graphs bi-variate relationships of statistics.
The Visualize Blobs tool is useful for identifying blobs with
certain statistical characteristics (e.g., anomalies).
The user can draw a polygon in the graphical plane enclosing plotted
points of interest, as illustrated in Figure 14, by clicking
at each vertex and double-clicking at the final vertex.
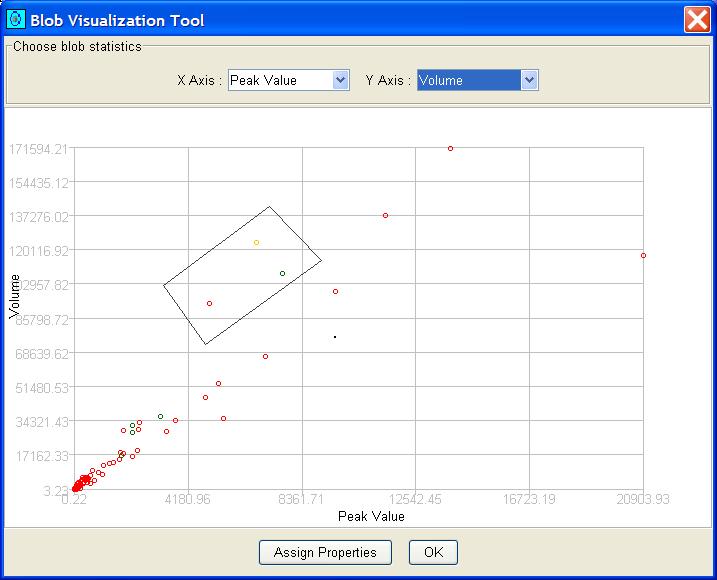
Figure 14: The Visualize Blobs with designated blobs enclosed by a polygon.
Then, the user can click the Assign Properties button to bring
up the blob group metadata popup, shown in Figure 7, for setting
metadata of the corresponding blobs.
Contents
Previous: Image Processing
Next: Pattern Recognition
GC Image™ Users' Guide © 2001–2004 by GC Image, LLC, and the University of Nebraska.