GC Image has rudimentary tools to interactively store and re-use blob metadata (user-defined data about the blob peaks such as chemical name, chemical group, and internal standard association). The improvement of these tools is an ongoing priority. Improved tools will reduce the interactive work necessary for GCxGC analysis.
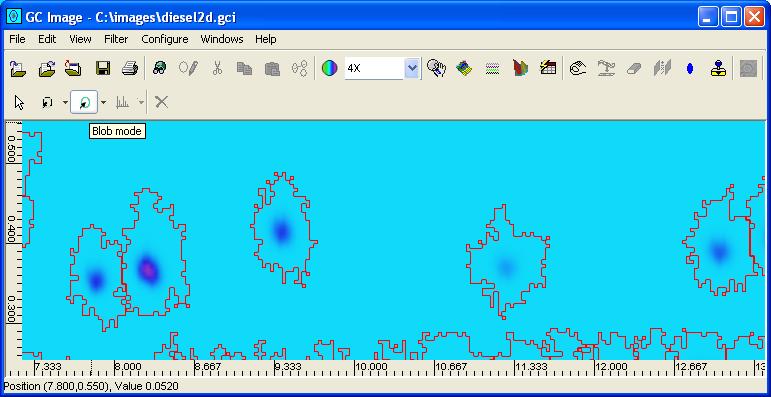
An example of the graphical highlights is shown in Figure 1.
The next section describes the process of including blobs for reporting and setting the metadata values, such as chemical name and group name.
To set the metadata for a blob, it must first be selected. Figure 2 shows the Blob Mode button on the Image Viewer palette.
In pixel blob-selection mode, a blob is selected by moving the cursor over any pixel inside the border of the blob and clicking the left mouse-button. Once a blob is selected in pixel blob-selection mode, other blobs can be added to the selection set by holding the Control-Key during the click of the left mouse-button while the cursor is inside the next blob to be selected.
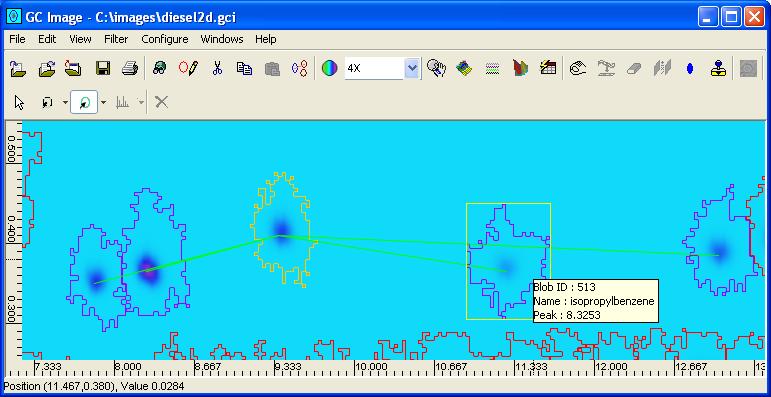
In line blob-selection mode, a series of blobs can be selected by moving the cursor to one side of the series of blobs, depressing the left mouse-button, moving the cursor to the other side of the series (defining a line through the series), and releasing the mouse button. All blobs crossed by the line will be selected.
In rectangle blob-selection mode, a group of blobs can be selected by moving the cursor to a point above (or below) and left (or right) of all blobs to be selected, depressing the left mouse-button, moving the cursor below (or above) and right (or left) of all the blob peaks to be selected (defining a bounding box), and releasing the mouse button. All blobs with the peak pixel in the rectangle will be selected.
In polygon blob-selection mode, a group of blobs can be selected by moving the cursor to a point near the blobs to be selected, clicking the left mouse-button, repeatedly moving the cursor around the blobs to be selected and clicking the left mouse-button (drawing a polygon), and double clicking the left mouse-button (to close the polygon). All blobs with the peak pixel in the polygon will be selected.
In blob draw mode, pixels are included by depressing the left mouse-button on the border of the new blob, moving the cursor along the desired outline of the blob (drawing an outline), and releasing the cursor at the end of the outline (causing the outline to be closed and all unassigned interior pixels to be assigned to the new blob).
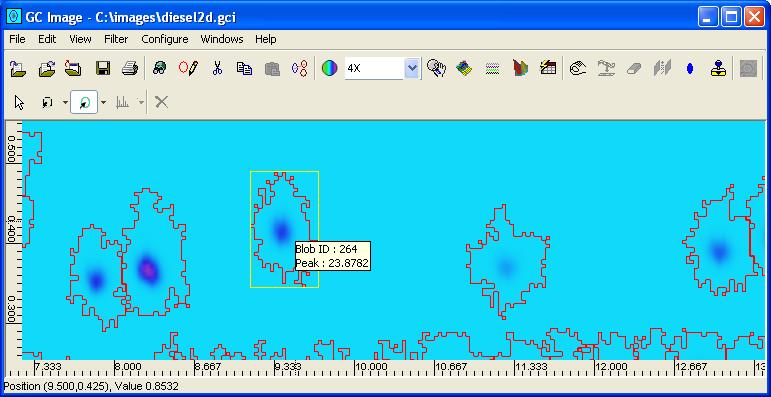
The blob(s) that are selected are highlighted with a colored box. Figure 3 shows a selected blob with a mouse-over that shows information about the blob.
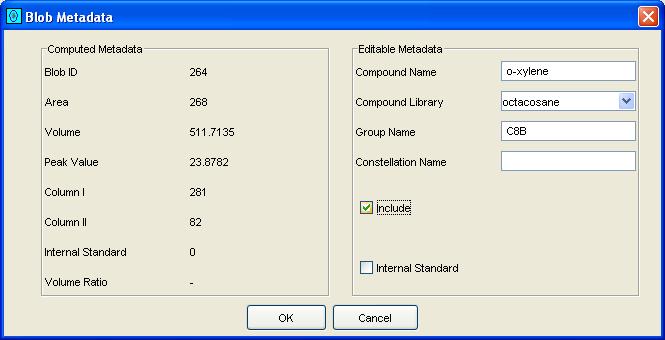
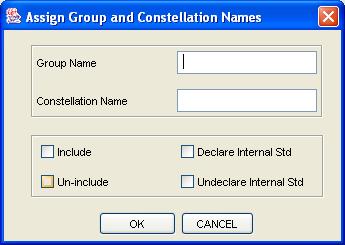
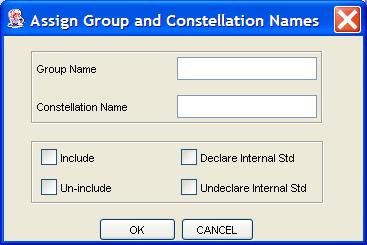
If multiple blobs are selected, the popup dialog will not display the values specific to individual blobs. If multiple blobs are selected the popup, illustrated in Figure 5, allows setting only the chemical group name and constellation name (with the values applied to all selected blobs), a checkbox to indicate whether or not the selected blobs are to be included, and a checkbox to indicate whether or not the selected blobs are internal standards.
The internal standard of a blob that is not itself an internal standard is, by default, set to the nearest blob that is an internal standard. The defaults are applied when blobs are included and when an internal standard is included or excluded. The internal standard of a blob can be changed by selecting the blob and cycling the association from one internal standard to the next until the correct association is made. Cycle the internal standard by first selecting an included blob (that is not an internal standard) and then clicking the Cycle Internal Standard from the tool bar or Edit menu of the Image Viewer.
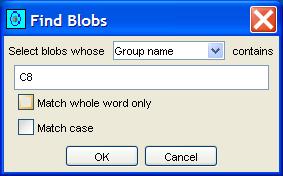
GC Image provides a Find Blobs tool, pictured in Figure 6, for selecting blobs on the basis of blob ID, compound name, group name, and constellation name. For example, all blobs with a specific group name could be selected en masse.
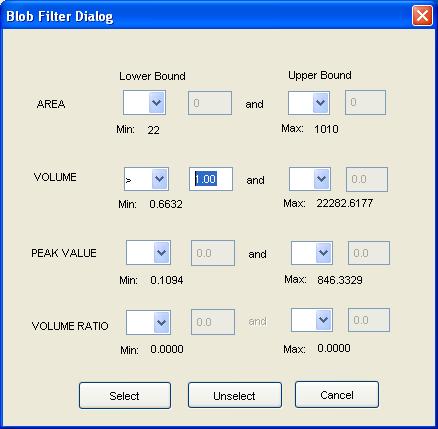
GC Image provides a Filter Blobs tool, pictured in Figure 7, for selecting (or deselecting) blobs on the basis of area, volume, peak value, and volume ratio. For example, all blobs with a sufficient peak height could be selected en masse. Similarly, all blobs with insufficient area could be deselected.
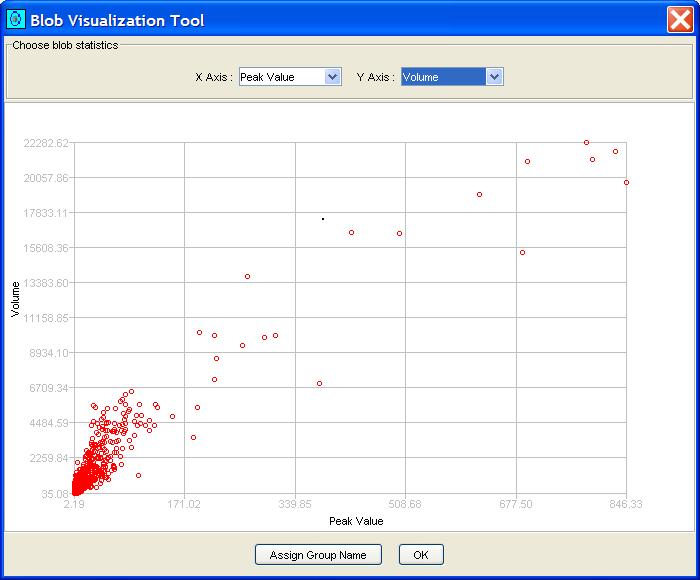
GC Image provides a Visualize Blobs tool, pictured in Figure 8, for graphing bi-variate relationships between blob statistics. For example, the tool can be set to show volume and peak value of each blob.
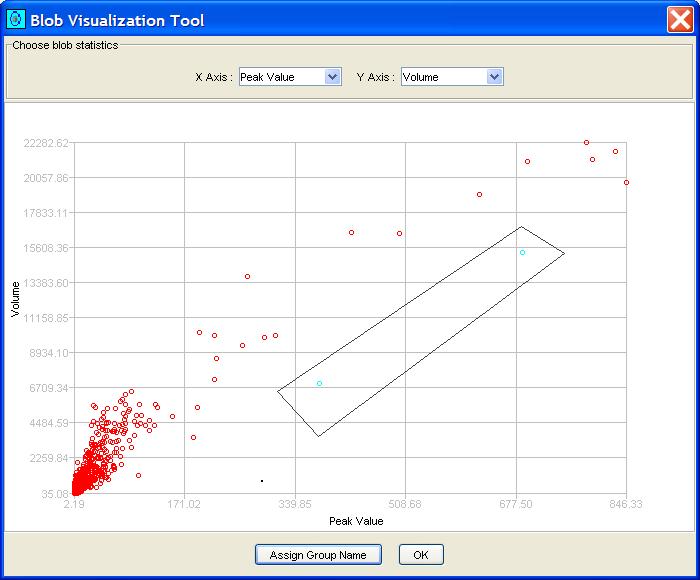
The Visualize Blobs tool is useful for identifying blobs with certain statistical characteristics (e.g., anomalies). The user can draw a polygon enclosing graphical points of interest, as illustrated in Figure 9, by clicking at each vertex and double-clicking at the final vertex.
Then, the user can click the Assign Properties button to bring up a popup, shown in Figure 10, for setting metadata of the corresponding blobs.
GC Image supports more than 80 of computed attributes and metadata for blobs. The white paper, GCxGC Blob Metadata and Statistics in GC Image, describes in detail each of the available metadata and computed attributes in GC Image.
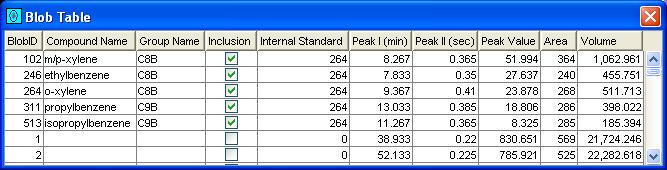
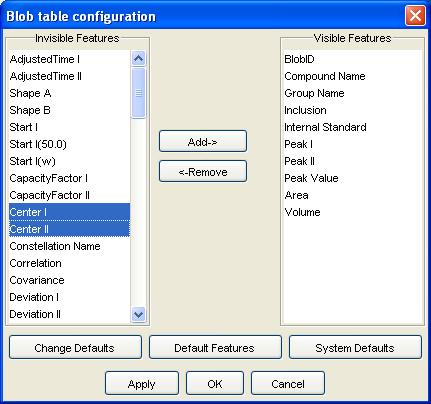
The blob table columns can be configured via the Configure->Configure Blob Table on the Image Viewer menu. The Configure Blob Table tool, pictured in Figure 12, allows the user to add or remove columns from the blob table configuration. A column(s) can be reordered by removing and re-inserting in a new position.
The blob table can be exported as a text file from the File->Save Blob Table menu item on the Image Viewer. The exported blob table will contain only the columns specified by the blob table configuration. The blob table is saved as text in comma-separated-values (CSV) format, which can be imported directly in the Microsoft Excel and other data analysis software.
The first step in using the Edit Blobs tool is to select a blob in the Image Viewer (as described above using one of the blob-selection modes from the palette) or to select a rectangular sub-region of the image (as described in chapter Graphics). After a single blob or a rectangular sub-region is selected, start the Edit Blobs tool from the Edit menu in the Image Viewer.
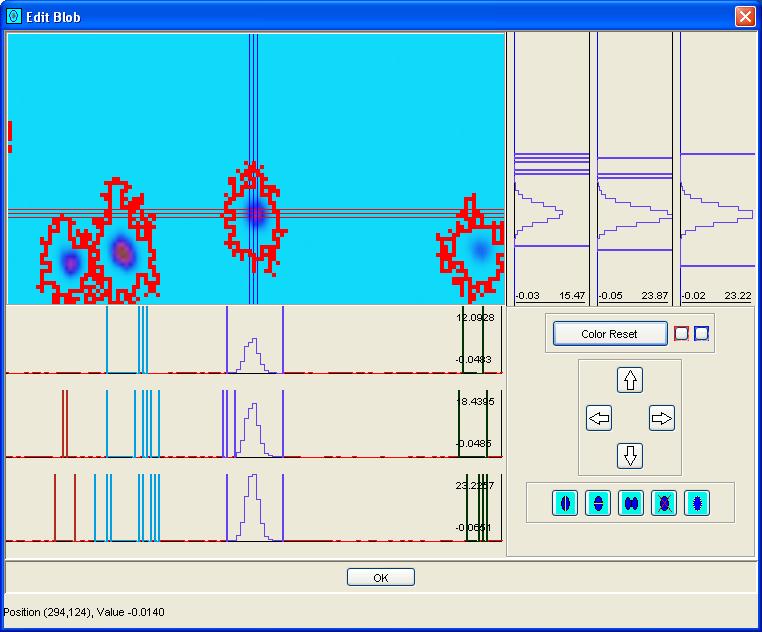
The Edit Blobs tool resembles the Multi-Projections tool in that it has a sub-image in the upper-left, graphs of slices of rows in the bottom-left, graphs of slices of columns in the upper-right, and a control pane in the lower-right. The sub-image can be shifted by click-and-drag in the sub-image. The Edit Blobs tool can be resized to show a larger or smaller sub-image, but the resolution is fixed.
The Edit Blobs tool also shows three row and three column slices. The cross-hairs indicate the three row and three column slices in the sub-image that are graphed. The cross-hairs can be relocated in the sub-image by holding the Shift-Key while clicking the left mouse-button on the desired location. The cross-hairs can be moved incrementally with the four arrow buttons on the Edit Blobs control pane.
Blobs along the sliced rows and columns can be edited in one dimension by moving the delimiters at the edge of the blob. The delimiters are moved by clicking with the left mouse-button and dragging to the desired location. The change in the blobs outline can be seen both in the slice and in the sub-image. If a shared delimiter is moved, both blobs are affected.
The Edit Blobs control pane has five additional buttons for editing blobs. There are buttons for splitting the blob at the center of the cross-hairs either horizontally or vertically along the cross-hair. Pressing these buttons will split the blob in the specified direction. There is a button for deleting the blob at the center of the cross-hairs. Pressing this button will delete the target blob. There is a button for merging two blobs. After pressing the button to merge blobs, the blob at the center of the cross-hairs is merged with the blob indicated subsequently by pointing the cursor and then simultaneously depressing the Shift-Key and the left mouse-button. There is a button for drawing a new blob anywhere in the sub-image. After pressing this button, locate the cursor on the desired border of the new blob, depress the left mouse-button, move the cursor along the desired outline of the blob (drawing an outline), and release the cursor at the end of the outline.
Blobs also can be deleted and drawn in the Image Viewer interface.
Note, currently there is not mechanism for journaling or undoing blob edits. These important features are in development.
A template contains much of the metadata of the included blobs. To save a blob template, select the Save Template option from the File menu. The template is stored as a text file tagged using an eXtensible Markup Language (XML) schema. A template will contain all of the included blobs, but only a subset of the information from the blob table is retained in the template. Specifically, each peak in the template has a label, peak location, chemical name, group name, constellation name, and internal standard reference.
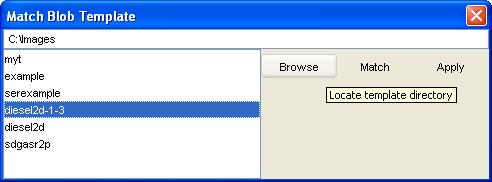
GC Image can match blob template(s) to the observed blobs in an image. Match Template is initiated from the Filter menu on the Image Viewer or with the button on the tool bar. The matching process has four steps, each step under user control:
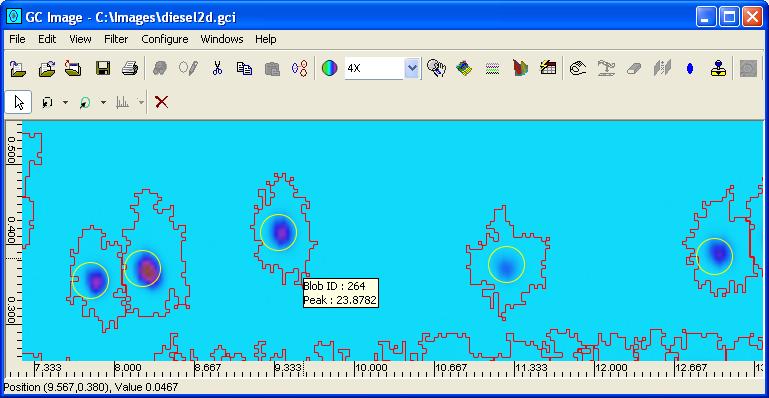
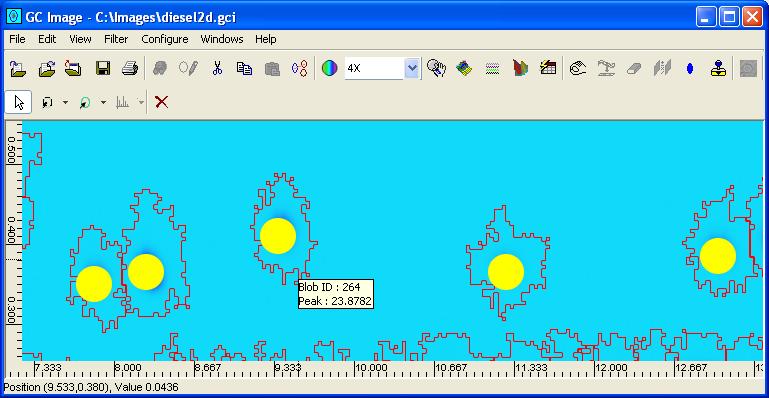
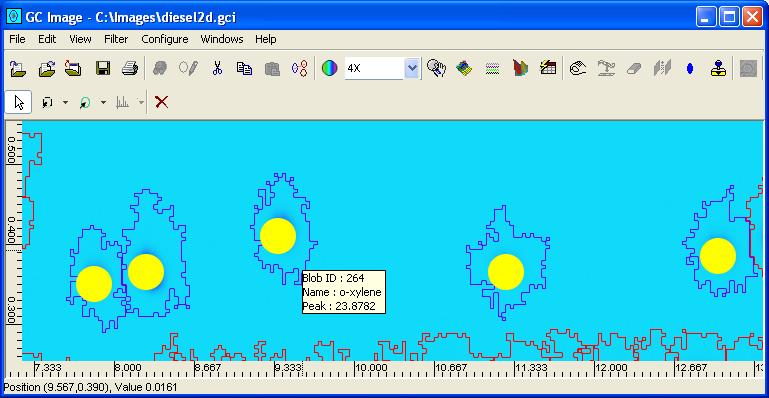
Figure 15.A illustrates the template peak locations overlayed on an image. As can be seen, the peak locations differ in the template and the image. Figure 15.B illustrates the result of matching the template peaks to the image peaks. Matched template elements are shifted to the matched location and color-filled. Unmatched template elements remain unfilled. Figure 15.C illustrates the result of applying the template metadata to the matched image blobs. A popup reports the number of the total template elements applied to the image and the names of the template elements that were not applied.
The template matching algorithm searches for a translation (i.e., horizontal and vertical shift) of the template that aligns it with target peaks. Then, only target peaks within a set distance of each template peak are matched. The algorithm can be parameterized via Configure->Configure Settings on the Image Viewer menu bar. The parameters are the half-width and half-height of the rectangular search window for translation of the template and the distance threshold for matching a template peak and target peak (after translation of the template).
GC Image has several tools for editing blob metadata. The Image Viewer menu and tool bar provide access to Cut Metadata, Copy Metadata, and Paste Metadata. The blob(s) must be selected with a blob selection tool before the blob metadata can be cut, copied, or pasted. Also, metadata values can be set directly in the Blob Metadata popup as described above.
Contents
Previous: Image Processing Filters
Next: Processing Configurations
GC Image™ Users' Guide © 2003, 2002, 2001 by GC Image LLC and the University of Nebraska.