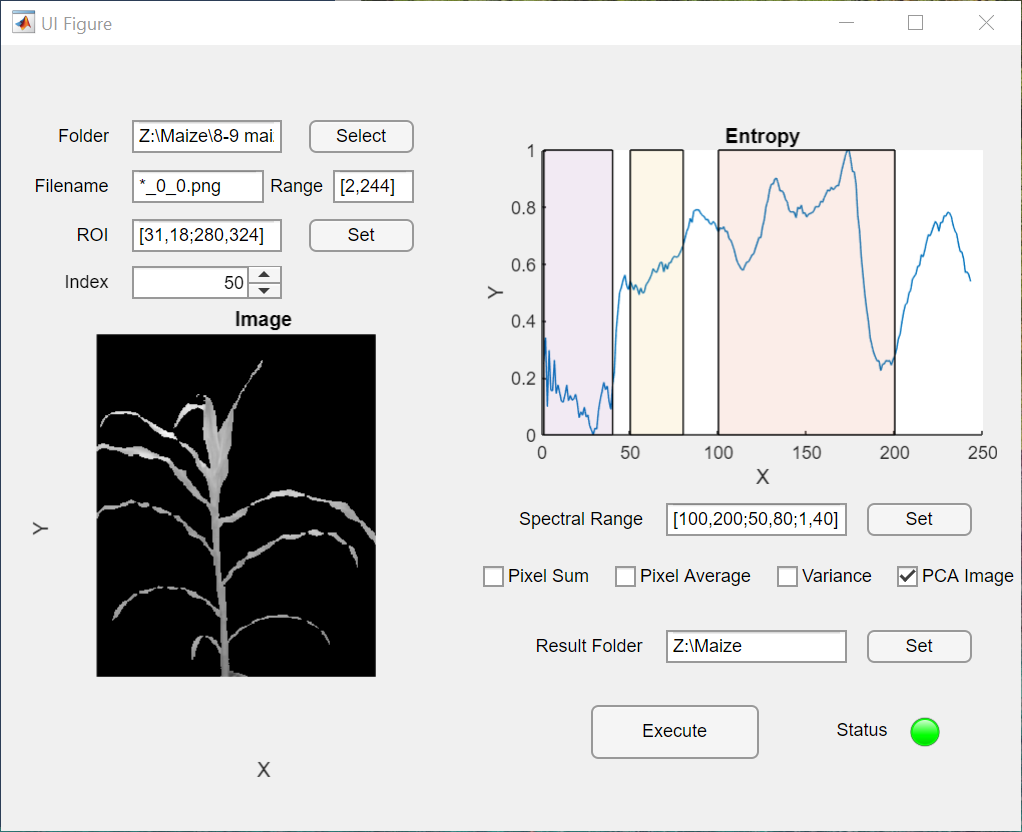
Hyperspectral Analyzer is a tool that can be used to analyze hypserspectral images. The user interface looks like the following figures. You should follow these stepsg: 1. Set the folder and file names The images will be found at a folder as the "Folder" field. The file names of the images are as the "Filename" field, where * will be replaced by a number. The number will be in the range determined by the two values in the "Range" field. Image 30_0_0.png will be used to segment the plant. 2. Set the ROI Click "Set" button, a pop-up figure will show up where a box can be dragged to dertime the ROI. A plot showing the entropy of every image will appear, which can be used to guide user selection of images. 3. Change the current image The current image can be changed by changing in values of the spinner. 4. Set the spectral range As not all of the images may be needed for processing, a part of or parts of the images can be used for processing. Click "Set" button to apply the ranges as in the "Spectral Range" field. The transparent regions show the ranges of imamges that will be processed. 5. Use the feature check boxes Check the check boxes to select features that will be extracted for images. 6. Set result folder Click "Set" button to set the folde where the results will be saved. 7. Execute the procesing Click "Execute" button to start processing. The results will be saved in the result folder. Download the app Hyperspectral Analyzer V1.3 (Internal Functions) here.MATLAB Application Download the app Hyperspectral Analyzer V2.0 (Batch Processing & Custom Functions) here.