A. MATLAB's Handle Graphics
-
Handle graphics refers to MATLAB's low-level graphics functions that control graphic objects.
-
Handle graphics functions are useful for detailed program control of MATLAB plots.
-
There are two ways to view and change properties of graphic objects:
-
Interactively using the property editor
-
Under program control using the get() and set() functions.
-
-
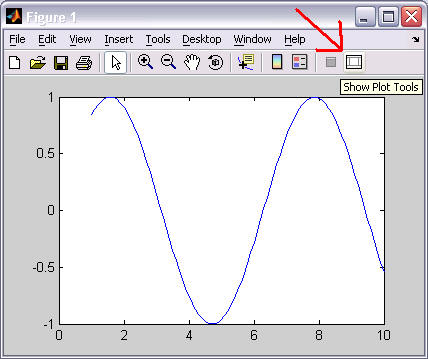
In CS211 we will concentrate on the manipulation of graphical elements under program control. However, using the interactive property editor is a good way to investigate graphic object properties. To use the property editor, click on the "Show Plot Tools" icon in the tool bar of a figure window. (The red arrow points to this icon below.)
-
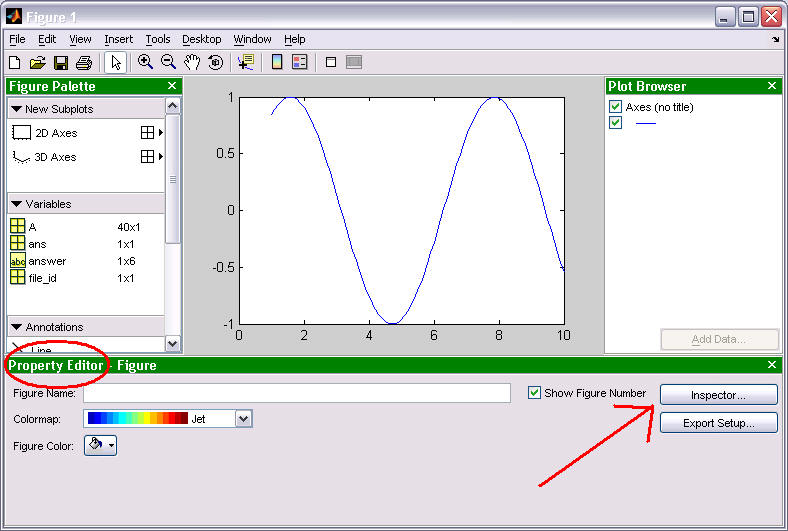
After clicking on the "Show Plot Tools" icon, you will see the larger window shown below. The property editor is in the lower section of this window. If you click on a graphic object in the plotting area of the window, the property editor will change to show you the major properties of that object. To view all of the properties of a graphic object, click on the "Desktop" item on the menu bar and then select "Figure Palette" and "Plot Browser".
B. Object Handles
-
In MATLAB, the term object refers to a graphics entity which has a handle and a set of properties.
-
A handle is a unique number used to identify a specific graphic object.
-
There are many types of graphic objects. Some examples include lines, axes, figures, text (in a figure window), menus, tool bars, buttons, ...
-
Most functions that create graphic objects return a handle to the object that was created. This handle can be used in later function calls to access and manipulate that specific graphic object. For example, if you wanted to have 3 figure windows open simultaneously and then change various properties of the individual figure windows, you might execute the following three lines of code:
Fig1_handle = figure(1);
Fig2_handle = figure(2);
Fig3_handle = figure(3);
Then you could change properties of one figure window without affecting the other two figures. For example, the "name" property of the each figure window could be changed with the following 3 commands:
set(Fig1_handle, 'Name', 'Example 1');
set(Fig2_handle, 'Name', 'Plot Window');
set(Fig3_handle, 'Name', 'MATLAB is fun!');
C. Object Properties
-
An object property has a unique name with an associated value that affects some aspect of the object's visual representation or behavior.
-
Most graphic objects share a core set of common properties. In addition, most graphic objects have specific properties that exist only for objects of a particular type.
-
To view all of the properties of a graphics object, you can:
-
look up the object's description in the MATLAB help system,
-
use the interactive property editor "More Properties", or
-
use the set(handle) function, which returns a structure array whose field names are the object's properties and whose values are the possible values for the corresponding property.
-
-
When a graphic object is created, every property of the object is assigned a default value.
-
To get property values of a graphic object, use the get() command.
-
get(handle) will return a structure array where each property is a field, and each field contains the current value of that property for this specific object.
-
get(handle, 'PropertyName') will return a single property value for the specified property.
-
-
To set property values of a graphic object, use the set() command.
-
set(handle) will return a structure array where each property is a field, and each field contains a list of the possible values this field could be set to.
-
set(handle, 'PropertyName', value) will set a single property value for the specified property for the specified graphics object.
-
-
The example "diary" of MATLAB commands below demonstrates possible uses of the set() and get() functions.
x = 1:0.1:10;
Line_handle = plot(x, sin(x));
Line_properties = get(Line_handle);
disp(Line_properties)
                 Color: [0 0 1]
             EraseMode: 'normal'
             LineStyle: '-'
             LineWidth: 0.5000
                Marker: 'none'
            MarkerSize: 6
       MarkerEdgeColor: 'auto'
       MarkerFaceColor: 'none'
                 XData: [1x91 double]
                 YData: [1x91 double]
                 ZData: [1x0 double]
          BeingDeleted: 'off'
         ButtonDownFcn: []
              Children: [0x1 double]
              Clipping: 'on'
             CreateFcn: []
             DeleteFcn: []
            BusyAction: 'queue'
      HandleVisibility: 'on'
               HitTest: 'on'
         Interruptible: 'on'
              Selected: 'on'
    SelectionHighlight: 'on'
                   Tag: ''
                  Type: 'line'
         UIContextMenu: 1.0760e+003
              UserData: []
               Visible: 'on'
                Parent: 665.9969
           DisplayName: ''
             XDataMode: 'manual'
           XDataSource: ''
           YDataSource: ''
           ZDataSource: ''
set(Line_handle, 'LineWidth', 3);
Width = get(Line_handle, 'LineWidth');
disp(Width)
     3
D. Graphic Object Organization - The hierarchy of handle graphic objects
-
All graphic objects that you create are organized into a "hierarchy of handle graphic objects." A diagram of such a hierarchy is shown below.
-
Each labeled rectangle in the diagram above represents a graphic object type. You cannot change or manipulate this hierarchy of objects, but if you know the handle to a single graphics object, then you can use the hierarchy to access related graphic objects.
-
All objects have parent and child properties.
-
The value of the parent property is the handle of an object's parent object. (Except for the root which has no parent.)
-
The value of the child property is a column vector of the handles of the object's children (possibly an empty vector).
-
The following example shows how to "move up" in an object hierarchy using the parent property:
X = -10:10;
Line_handle = plot(X, X.^2);
Axes_handle = get(Line_handle, 'Parent');
Figure_handle = get(Axes_handle, 'Parent');
-
-
The following is a brief description of the major object types:
-
root
-
The single object corresponding to the computer's screen on which graphics may be displayed.
-
There is only be one (1) root object.
-
The handle to the root is always zero (0).
-
-
figure
-
A figure window on the graphic screen.
-
There can be zero or more figure objects (each a child of the root).
-
-
axes
-
A rectangular coordinate system within a figure window.
-
There can be zero or more axes objects per figure object. (Remember the subplot() function?)
-
The parent object of an axes object is always a figure object.
-
-
line (an example of a Plot Object)
-
A line drawn within an axes.
-
There can be zero or more line objects per axes object.
-
The parent object of a line object is always an axes object.
-
-