Objectives:
Due Date/Time:
This lab is due at the beginning of class
on Lesson 20
(Tues/Wed, 4/5 Mar 2008).
Please submit an electronic copy of your PEX2.m file to
the course web site before the class starting time on the due date.
Please bring a hardcopy printout of your PEX2.m file to
class on the due date.
A late penalty accrues at a rate of 25% for each 24-hour period (including weekends) past the on-time turn-in date and time. The late penalty is a cap on the maximum grade that may be awarded for the late work. Thus zero points will be awarded for a programming exercise submitted 72 hours or more late. There is no early turn-in bonus for this assignment.
Help Policy:
AUTHORIZED RESOURCES:
Any, except another cadet’s program.
NOTES:
Never copy another person’s work and submit it as your own.
You must document all help received from sources other than your instructor.
DFCS will recommend a grade of F for any cadet who egregiously violates this Help Policy or contributes to a violation by others.
You must document all help received from any source other than your instructor.
The documentation statement must explicitly describe WHAT assistance was provided, WHERE on the assignment the assistance was provided, and WHO provided the assistance.
If no help was received on this assignment, the documentation statement must state “NONE.”
Vague documentation statements must be corrected before the assignment will be graded, and will result in a 5% deduction on the assignment.
Problem Overview:
Large amounts of data can become useful information if it is organized and presented visually. And speaking of large amounts of data, the US government gathers enormous amounts of data about the United States population. One such source of data is the Social Security Administration. And now, through the Internet, much of that data is available almost instantly. For example, you can get information about the names for new babes from http://www.ssa.gov/OACT/babynames/. Your task in this assignment is to analyze and visually display data downloaded from this web site.
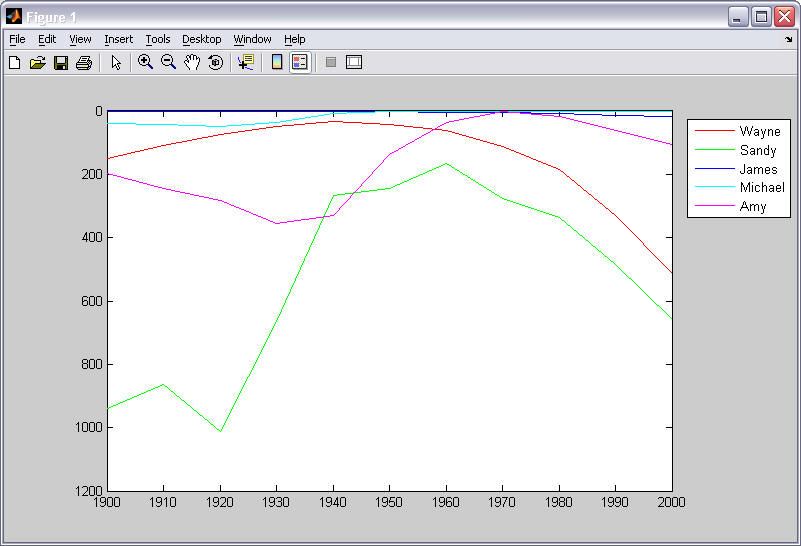
Have you ever wondered why some people's names are so popular, while other people's names fade out of common use? There may be some sociological explanation for it, but that is outside the scope of this assignment. Your assignment is to create a MATLAB program that will track the popularity of names over the last century (1900 to 2000). An example screen shot from such a program is shown below. The x axis represents time, in years. The y axis represents the ranking of a name's usage for new babies. If a name is ranked number 1 for a specific year, it was used more than any other name in that year. If a name is ranked 126th, then there were 125 more popular names in that year. Since small rankings represent higher usage, the y axis is drawn inverted, with larger ranking values toward the bottom of the graph. The curves shown in the screen shoot represent the 5 names in Dr. Brown's family. As you can see from the graph, the name "Wayne" was a fairly popular name during the first half of the century, but its usage has declined significantly over the last 30-40 years. When you finish your program, you will be able to create such a graph for your family. Pretty exciting, don't you think!
Program Description:
Your MATLAB program will be a command-line, menu driven program. A "driver" program that prompts for user input and calls appropriate functions to perform the requested actions is not complex. To save you development time, a driver program is provided for you (PEX2.m). This file contains the following functions:
Function name Description PEX2() Reads in the baby names data by calling Read_names_data() (see below) and then enters a loop that does not exit until the user selects the "quit" option. Get_user_option() Displays a set of user options and prompts the user for a selection, which is returned.
Read_names_data() We have not yet studied how to read data from a data file. We will cover these issues in lessons 23-26 later in the semester. Therefore, the code required to read the baby name data is provided for you. This function is called as the beginning of the PEX2 function and reads data from a file named "names-data.txt." You must have this data file in the same folder as you PEX2.m file when your program executes. This function returns data in two arrays:
- Baby_names - a 2D array of characters, where each row contains a unique name
- Name_rankings - a 2D array with 1 row and 11 columns for each baby name; the 11 columns are the rankings for years 1900, 1910, 1920, .. , 2000 respectively.
You should study the code provided in the PEX2.m file and make sure you understand its basic structure. The code in the primary function PEX2() and the sub-function Get_user_option() should be completely understandable from your current knowledge of MATLAB. You do not need to understand the Read_names_data() code.
Your task is to add code and appropriate sub-functions that will perform the actions described in the Get_user_option() function. Specifically, you must add code to PEX2.m that performs the following tasks:
1: Plot a single name's rankings
2: Plot a set of similar name rankings
3: Clear graph
4: Calculate name statistics
5: Display a bar chart describing the changes in names from census to census
0: Quit
Each of these tasks is explained in detail below. In addition, the HINTS section gives you specific help on some of the harder implementation issues. The code that you add should conform to good program design. If you can accomplish a task using only a few lines of code, then you can place these statements in the appropriate case block of the switch statement in PEX2(). If a task requires more than a few lines of code, then it should be performed in a separate sub-function, with a call to this function placed in the appropriate case block of the PEX2() switch statement. It is sometimes a "judgment call" on whether to make a group of statements a separate function. If you are unsure whether a particular group of code should be a separate sub-function or not, discuss it with your instructor.
Tasks 1 and 2 below will plot lines into a line graph. For full credit on this assignment, you must create a sub-function that will plot a single line into the graph. The input and output arguments required for this sub-function are shown below. This function should then be called with appropriate input arguments to accomplish the plotting for tasks 1 and 2. (PLEASE NOTE: There is flexibility in how this sub-function is implemented. If you need to modify the input and/or output arguments to match your program design, you may do so.)
%==========================================================================
function Names_plotted = Plot_name(Name, Rankings, Names_plotted, Max_ranking)
%--------------------------------------------------------------------------
% DESCRIPTION: Given a baby name and its rankings, plot the rankings
%
% INPUTS: Name - A vector of characters; the baby name.
% Rankings - A vector of rankings; 11 census values
% Names_plotted - The previous names that have already been plotted.
% Max_ranking - The maximum ranking of any name in the data.
%
% OUTPUTS: Names_plotted - The "Name" is appended to the last row.
%
%--------------------------------------------------------------------------
1) Plot a single name's rankings
Prompt the user for a baby name.
If the name that was entered is not capitalized, change the first letter of the name to its corresponding capital letter. (All of the names in the Baby_names array start with a capital letter. Your search for a matching name will always fail unless the first letter is capitalized.)
Search the Baby_names array for a matching name.
If a matching name is found, plot the name's rankings in the graph. (Limit the number of plot lines in any one graph to 7. If more than 7 plot lines are request by the user, do not plot the additional names and display an appropriate error message to the console window.)
If a matching name is not found, display an appropriate message and leave the graph unchanged.
Each plot line is the graph should have a unique color and be labeled in the legend with its associated baby name.
2) Plot a set of similar name rankings
Prompt the user for a PREFIX of a baby's name.
If the PREFIX that was entered is not capitalized, change the first letter of the name to it corresponding capital letter.
Search the Baby_names array for all matching names. For example, if the user typed in "Way," the names "Wayland," "Waylon," "Waymon," and "Wayne" should be plotted.
If one or more matching names are found, plot each name's rankings in the graph. (Limit the number of plot lines in any one graph to 7. If more than 7 plot lines are request by the user, do not plot the additional names and display an appropriate error message to the console window.)
If a matching name is not found, display an appropriate message and leave the graph unchanged.
Each plot line is the graph should have a unique color and be labeled in the legend with its associated baby name.
3) Clear graph
Clear the graph of all current plot lines and legend information.
4) Calculate name statistics
Calculate and display the number of names that are in the array Baby_names.
Calculate and display the largest ranking value in the Name_rankings array and in what year it happened. (All years do not have the same number of names ranked. Which year ranked the most names and what was the number of rankings?)
Calculate and display how many names have been consistently used over the last 100 years. Specifically, how many names have a non-zero entry for every ranking value in their row of the Name_rankings array?
Calculate and display the number of names that are no longer being used. Specifically, how many names have a 0 ranking for the year 2000?
Calculate and display the number of names that are new in the last 25 years. Specifically, how many names have a 0 ranking for years 1900-1970, but have a non-zero ranking in at least one of the years 1980-2000?
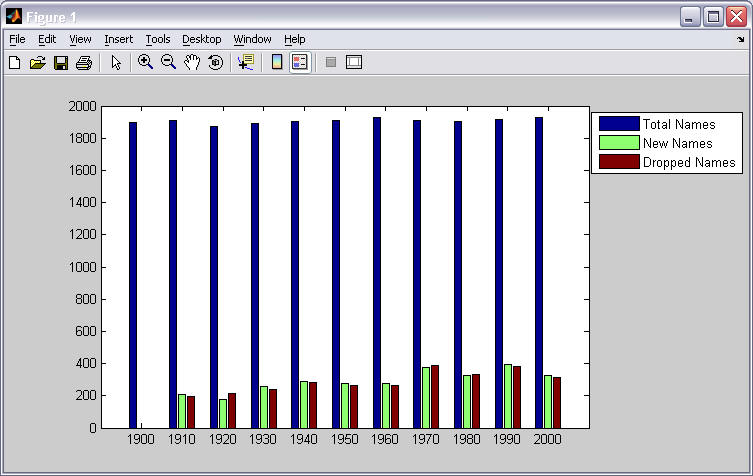
5) Display a bar chart describing the changes in names from census to census
Create a bar chart that displays 3 values for each year in the data (years 1900, 1910, 1920, ... 2000):
The total number of names that were used (ranked) for that year
The total number of names that are new for this year. (This is, any name that had a zero ranking in the previous year, but a non-zero ranking in this year.)
The total number of names that have been dropped from
usage this year. (That is, any name that had a non-zero-ranking in the
previous year, but a zero ranking in the current year.)
Your bar chart should look something like the one shown below. Notice that the bars for year 1900 show no new or dropped names because there is no previous year's data to compare against.
Helpful Hints:
General comments:
Thoroughly document your code with comments including a
standard program header comment block and appropriate comments in
your code. Make sure the References:
section of your program header includes a description of any help
you received on the assignment in accordance with the assignment Help
Policy. Each sub-function must have an appropriate header comment block.
You can follow the same style that is already included in the PEX2.m file or
you can modify the commenting style to your liking. But the same style of
comments should be used consistently throughout the entire file and no
information should be missing.
Use white space (space characters and blank lines) to make
your code easier to read. Ensure that your code is appropriately
indented. You can select all of your code and then press Ctrl-I for
smart indent. Avoid excessively long lines that wrap around to
multiple lines in the editor. You can use
... to continue a single statement across two lines in your
m-file (as long as the break is not in a string constant).
Create descriptive names for all of your variables and constants and ensure your are consistent in the format of your constant and variable names (e.g., first letter capitalized, underscores between words).
Task specific comments:
1) Plot a single name's rankings
Use the MATLAB function strmatch(single_name, 2D_array_of_names_to_search, 'exact') to find matching names. The return value will be either:
the row in the array of names that was searched where a match was found, or
an empty vector (which means no matches were found).
Use the isempty() function to test whether a variable has no data in it.
The ASCII code for capital letters and small case letters are all different by exactly 32. For example, the ASCII code for 'a' is 97, while the ASCII code for 'A' is 65. The ASCII code for 'b' is 98, while the ASCII code for 'B' is 66. etc. To change a small case letter into a capital letter, simply subtract 32 from it. There is also a built-in function to convert to upper case. You can call the upper() function with the first character of the string name. For example, Name(1) = upper(Name(1));
To plot multiple lines into a single graph, use hold('on').
To clear a plot (technically called an "axes"), call cla(), which stands for "CLear Axes."
To have the y axis increase downward, use the call axis('ij').
Make sure you replace all zeros in a name's rankings with a value that is higher than the highest ranking so that these values will plot in reasonable places. (A zero ranking represents the fact that the name was not used at all in that particular year and we want this to be indicated by graphing it at the lowest point on the graph.)
Plot lines will remain on the graph (assuming you have called hold('on')) while you plot new lines. This is not true for the legend. To get more than one name in the legend, you need to send the legend() function a 2D array of characters, where each row contains a string of characters for each label. As you plot each name, you will have to remember the names in a separate 2D array so that you can update the legend correctly for each new plot. Use the following commands to create and add names to your array of legend names, changing the variable names to be consistent with your program.
To create an empty character array: Legend_names = char([]); To add a new row with a new name to the array: Legend_names(end+1,1:length(Name)) = Name;
There are several ways to get a different color for each plot line (up to 7 colors). One of the easiest ways is to create an array of linespec strings, as in:
Line_colors = [ 'r', 'g', 'b', 'c', 'm', 'y', 'k' ];
Then, if you know that you are plotting the 5th line into the graph, your plot function would look something like:
plot(x,y, Line_colors(5));
You will have to keep a count of the number of plot lines you have drawn for several reasons. And you can use that "count" variable to select an appropriate color for the line plot.2) Plot a set of similar name rankings
Use the MATLAB function strmatch(single_name, array_of_names_to_search) without the 3rd 'exact' parameter to find matching names. The return value will be either:
a column vector that contains every matching row in the array of names that was searched, or
an empty vector (which means no matches were found).
Use the same hints for plotting given in the previous section.
Consider making a function that received a single name and a row vector of its rankings and plots the line for this data. Then you could call this function for each name that needs to be plotted. Remember, if you have duplicate code in your program, there is a good chance it should be combined into a single function to remove the duplication.
3) Clear graph
To clear a plot (technically called an "axes"), call cla(), which stands for "CLear Axes."
To remove a legend, send the legend command an empty string, as in legend('');
4) Calculate name statistics
You can use loops to count the number of values in the rankings array that fall into each category, but your can use vector comparisons as well. Attempt to use vector comparisons before using loops. For example, to count the number of positive elements in an array, your could do the following:
count = sum( vector > 0 );
Remember that if the input parameter to a function is a 2D array, the function will typically process each column separately and return a row vector of answers.5) Display a bar chart describing the changes in names from census to census
To create the bar chart using the bar() function, you will need to create an 11 row by 3 column matrix. Each row should contain the 3 values related to a particular year.
If a figure window is already open, you must clear its current axes before using the bar() function so that the graph scale is set appropriately. Use cla() to clear a graph.
To make a plot have the y axis increasing upwards, use the command axis('xy').
To label the x axis, use the function call:
set(gca(), 'XTickLabel', {'1900', '1910', ..... } );
gca() stands for "Get Current Axes."
The purpose of these "helpful" hints is to address issues you may potentially
face while working on this assignment. It is not possible to anticipate all
potential problems you may face. Please start early on this assignment and
consult with your instructor when you get stuck.
Grading Information:
Proper Documentation Statement (-5 pts)?
|
Criteria |
Pts |
|
Good programming practice and design |
35 |
|
Standard header comment block for the file with all elements appropriately filled in |
5 |
|
Header comment block for each function with all elements appropriately filled in |
5 |
|
Appropriate commenting in the program body (section comments, variable descriptions) |
5 |
|
Meaningful and consistently formatted variable names |
5 |
|
Easy-to-read program formatting (appropriate use of spaces within lines, similar statements grouped and separated with a blank line) |
5 |
|
The code is grouped into appropriate sub-functions with appropriate arguments passed |
10 |
|
Program correctness |
65 |
|
Plots a single name's rankings into the graph correctly |
20 |
|
Finds a matching name and plots it |
5 |
|
Finds multiple matching names and plots accordingly |
8 |
|
Clears graph correctly |
2 |
|
Calculates statistics correctly |
15 |
|
Creates correct Bar chart |
15 |
|
Totals |
100 |
|
Late Penalties (-25, -50, -75 -100) |
|
References
This assignment is a modified version of a Computer Science assignment first created by Nick Parlante (http://nifty.stanford.edu/2005/NameSurfer/).