
Objectives:
Due Date/Time:
This lab is due at 1630
on Lesson T12 (11 Feb).
Please submit an electronic copy of your PEX1.m file to
the course web site before the class starting time due date.
Please bring a hardcopy printout of your PEX1.m file to
class on the due date.
A late penalty accrues at a rate of 25% for each 24-hour period (including weekends) past the on-time turn-in date and time. The late penalty is a cap on the maximum grade that may be awarded for the late work. Thus zero points will be awarded for a programming exercise submitted 72 hours or more late. There is no early turn-in bonus for this assignment.
Help Policy:
AUTHORIZED RESOURCES:
Any, except another cadet’s program.
NOTES:
Never copy another person’s work and submit it as your own.
You must document all help received from sources other than your instructor.
DFCS will recommend a grade of F for any cadet who egregiously violates this Help Policy or contributes to a violation by others.
You must document all help received from any source other than your instructor.
The documentation statement must explicitly describe WHAT assistance was provided, WHERE on the assignment the assistance was provided, and WHO provided the assistance.
If no help was received on this assignment, the documentation statement must state “NONE.”
Vague documentation statements must be corrected before the assignment will be graded, and will result in a 5% deduction on the assignment.
Problem Overview:
This programming exercise requires you to create a MATLAB program that will calculate and display images of the Mandelbrot set, a fractal which is described below. Your program will read in four(4) inputs from the user, display a single image, and output some statistics about the image in the command window. Part of this assignment is to help you develop strong programming practices. Please note that 40% of the points for this assignment are based on good programming techniques, independent of the program's correctness.
The Mandelbrot Set
The Mandelbrot Set, shown in the image below, is a set of points in the complex plane that have some very interesting properties. For example, the shapes created by the set of points are self-similar -- that is, they create many copies of the same shape at different scales. In addition, the set of points has an infinite complexity -- regardless of how much you zoom into the set of points you see new and interesting shapes.
A point in the complex plane, c = (a + bi), is considered part of the Mandelbrot Set if repeated squaring and additions of the point using the equation zn = z2n-1 + c, do not result in an infinite value, where z0 (the first value of z) is always 0. (Mathematicians call this a divergent function if it goes to infinity-- but this is not a math class, so we will skip most of the math details.) If you repeatedly perform this operation on a value c, and the result always stays below 2.0, then you can be fairly certain that the value will never grow to infinity. If you ever get a value greater than or equal to 2.0, you know immediately that the repeated calculation will produce an infinite result.
Technically, a complex number c is either in (or not in) the Mandelbrot Set, as described above. However, you can create some very nice images by assigning different colors to each complex number in a region based on how many iterations of the equation it takes to get a value greater than or equal to 2.0. This is what you will do for this assignment.
MATLAB Images
MATLAB has many built-in functions that produce graphical output. One such function is the image() function that will treat each value in a 2D array as a color index value and display a "picture" of the array data. For example, the two MATLAB commands below will produce a 300-by-300 pixel image of random colors. (We will cover more details about graphical output in future lessons and only introduce some basic concepts for this assignment.)
My_colors = floor(rand(300) * 64);
image(My_colors);
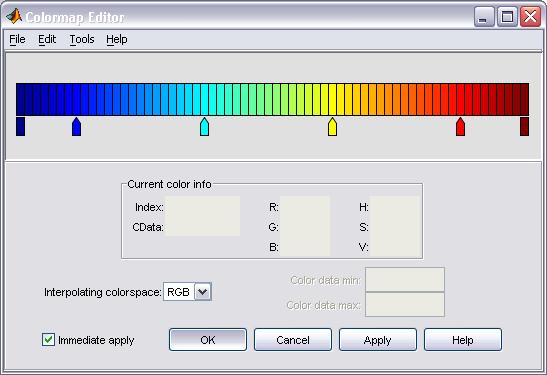
The color index values, by default, are indexes into a color map containing 64 colors, as shown in the figure below. You can see (and edit) the color values in the color map using the MATLAB command colormapeditor(). (We highly recommend that you do not edit the default color map for this assignment! If you do change the color map, it can be restored to its original values using the command colormap('default') )
Program Description:
Your MATLAB program should be a single function that implements the following steps. You should implement and test each step before going to the next step. Please read the Helpful Hints section below BEFORE you begin programming.
Clear the command window.
Display a useful introduction to the program's user in the
command window.
Get the limits on the x (real) axis and the y (imaginary) axis that define a rectangular region in the complex plane.
a. prompt for and get from the user the left limit of
the x axis; the input can be any floating point number and does not
need to be validated
b. prompt for and get from the user the right limit of the x
axis; the input must be validated to be greater then the left limit
c. prompt for and get from the user the bottom limit of the y
axis; the input can be any floating point number and does not need to be
validated
d. prompt for and get from the user the top limit of the y
axis; the input must be validated to be greater then the bottom limit
Create an 2D array containing all ones. The size of the
array should be defined by "constants" at the top of your program.
a. Calculate (or set) a variable c equal to the complex number
associated with this row/column position in the 2D array
b. Initialize a variable z to 0
c. Repeatedly calculate the formula z =
z2 + c until the magnitude of z
gets greater than or equal to 2.0 or you have done the equation at least 64
times. In addition, count the number of times the equation is calculated.
d. Set the value of your 2D array at this row/column position to the number
of times you executed the equation.
Display the image represented by your 2D array using the
image() command.
Display text to the command window that contains the following information. Make sure your output is nicely formatted. Only values that never exceeded 2.0 in your calculation loop after 64 tried are considered part of the Mandelbrot Set. All other points are definitely not a part of the set.
For this image:
There are ??? points probably in the Mandelbrot Set
There are ??? points definitely NOT in the Mandelbrot Set
If all of the points represented in the image are part of the Mandelbrot set, display the message:
All of the points are probably in the Mandelbrot set - not very interesting!
If all of the points represented in the image generated a value greater than 2.0 on their first calculation, display the message:
Your image is totally blue -- not very interesting!.
Please select a region of the complex plane closer to the origin.
Helpful Hints:
X_left = -2.0;
X_right = 0.5;
Y_bottom = -1.0;
Y_top = 1.0;
This eliminates the need to enter data every time you test your program. When you believe your code is correct, delete these lines and uncomment your data input statements.
|
Column 1 |
Column 10 |
|||||||||
| row 1 (y = top limit) | -2.0+1i | 0.5+1i | ||||||||
| row 10 (y = bottom limit) | -2.0-1i | -1.72-1i | -1.44-1i | -1.16-1i | -0.88-1i | -0.61-1i | -0.33-1i | -0.06-1i | 0.22-1i | 0.5-1i |
(0.4 - 0.3) / (100 - 1)
If you use this equation, modify it to use appropriate variables from your program.
c = complex(x, y);
Thoroughly document your code with comments including a
standard program header comment block and appropriate comments in
your code. Make sure the References:
section of your program header includes a description of any help
you received on the assignment in accordance with the assignment Help
Policy.
Use white space (space characters and blank lines) to make
your code easier to read. Ensure that your code is appropriately
indented. You can select all of your code and then press Ctrl-I for
smart indent. Avoid excessively long lines that wrap around to
multiple lines in the editor. You can use
... to continue a single statement across two lines in your
m-file (as long as the break is not in a string constant).
Select descriptive names for all of your variables and constants and ensure your are consistent in the format of your constant and variable names (e.g., first letter capitalized, underscores between words).
Grading Information:
Proper Documentation Statement (-5 pts)?
|
Criteria |
Pts |
Grade |
Comments |
|
Good programming practice |
40 |
|
|
|
Standard header comment block with all elements appropriately filled in |
8 |
|
|
|
Appropriate commenting in the program body (section comments, variable descriptions) |
8 |
|
|
|
Meaningful and consistently formatted variable names |
8 |
|
|
|
Declared constants where appropriate |
8 |
|
|
|
Easy-to-read program formatting (appropriate use of spaces within lines, similar statements grouped and separated with a blank line) |
8 |
|
|
|
Program correctness |
60 |
|
|
| Clears window and displays program introduction |
4 |
||
|
Data input and validation |
16 |
|
|
|
Creation of the 2D array |
3 |
|
|
|
Calculation of the color values for each position of the 2D array |
22 |
|
|
| Display of the image |
1 |
||
|
Calculate and display of the image statistics |
6 |
|
|
|
Calculate and display of the "all in set" message |
4 |
|
|
|
Calculate and display of the "all out of the set" message |
4 |
|
|
|
Totals |
100 |
|
|
|
Late Penalties (-25, -50, -75 -100) |
|
|
|
|
Final Grade |
|
|
|